Out of Water Vel Sensor
We are developing a new velocity sensor which we hope will be able to detect the velocity of flowing water when placed outside of a flowing water body. The motivation for this is to ease the installation process, as this would allow the sensors to be installed without the removal of drain covers. The sensor should be capable of penetrating concrete drain covers and detecting the flow of water underneath.
Contents
21st January 2020
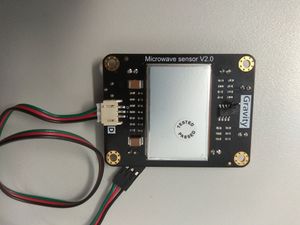
Microwave Doppler shift motion detectors can be sourced very affordably from the internet. Microwaves will readily penetrate thick concrete, but can also be easily blocked using a faraday cage to remove external noise. Our goal is to modify one of these sensors to detect not just motion, but the velocity of motion as well. We are currently using the Gravity Digital Microwave Sensor, which uses a 10.525 GHz microwave source.
The sensor sends out a signal and uses the phase difference between the outgoing and incoming waves due to doppler shift as a measure of velocity. hen a threshold velocity is observed, which is not useful for our application. The sensor outputs a digital high/low signal when a threshold velocity is observed. Our first task is to backtrack through the circuitry of the sensor, to probe the raw measured signal which measures the amplitude of the observed velocity.
By investigating the schematics for the sensor, we found that probing the pin 1 output of the LMV358 op-amp gave us a signal whose amplitude correlates well with velocity. We intend to find a calibration curve which will allow us to relate the amplitude of this signal to velocity.
The data taken below is a measure of the voltage output of the probed velocity sensor data over number of measurements. The measurement frequency is set to 5kHz. While no velocity is observed, the signal floats at around 208 which corresponds to approximately 1V. When agitated, the sensor outputs readings between 0 and 1023, (0-5V). Due to the signal floating at 208, we intend to use the time-averaged absolute difference between the current reading and 208 as a measure of velocity amplitude. Our next task will be remove the noise in the signal. The voltage output reading is clearly bounded by a reading of 1023 (5V). This will create some uncertainty when measuring very high velocities which we will also need to somehow avoid.
22nd January 2020
A low pass filter was integrated into the circuit to remove the high-frequency noise present in the data taking. Further removal of noise was accomplished by taking the weighted sum of the past 40 measurements (with higher priority to the latest measurements). Testing with flowing water will indicate whether or not this has removed enough noise to produce a meaningful calibration curve. We are also investigating toggling the sensitivity of the sensor, and choosing an appropriate material for the faraday cage which will block out external noise.
4th February 2020
As there is still too much noise present in the velocity sensor’s readings, we smoothed out the readings by averaging over a longer interval. Frequent velocity measurements are not required anyway.
The sensor was used to attempt to measure the speed of flowing water in a flume. The sensor was wrapped up in aluminium foil, leaving only one side of the sensor open, which was pointed at the flowing water. Raw sensor data from pin 1 was taken alongside actual water speed measurements using a FloMate probe. Post-processing the raw sensor data shows that unfortunately, no correlation appears between the sensor velocity and FloMate probe.
The strength of the signal from the sensor was quite small, so there was clearly a lot of noise that could have affected measurements. There are several ideas for improving measurements. We will investigate increasing the sensitivity of the sensor (although this could increase noise as well). While using the averaging technique on the signal from pin 1 was useful for measuring the movement of solids, it did not work as well with water. Perhaps we may use an alternative form of measurement by using the frequency of the signal from the sensor's OUTPUT pin as a measure of velocity. We wish to also investigate using alternative breadboards for the sensor. We intend to continue using the HB100 microwave sensor for now, but it may be preferable to use alternative wiring for amplifying the signal from the HB100 sensor. Different breadboards might work better for detecting velocities.
5th February 2020
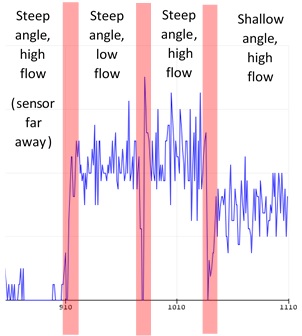
Experimentation was made with detecting the flow of water running through a 90mm diameter PVC pipe. Water flowed from a tap down through the PVC pipe, which was inclined at a variable angle. The following graph shows the relative frequency of motion detections made by the sensor. The horizontal scale is in units of time (each unit is around 0.5 seconds), and depicts various different setup arrangements. Throughout the last three measurements, the sensor was placed directly next to the pipe and was pointed at the pipe. For the first measurement, the sensor was placed roughly 25cm away from the pipe. When there was no flowing water in the pipe, the sensor consistently read a 0 frequency of motion detections
These measurements give us a qualitative understanding of the sensor’s abilities, in particular, that being any more than a mere 25cm away from the pipe gives us no data. The sensitivity was increased to account for this, but it was found that even with slightly increased sensitivity, the sensor was picking up ambient movements. Measurements were also unchanged by turning the flow of water on/off.
We also see that changing the flow of water leaves the detection frequency virtually unchanged, even though the flow of water was changed quite substantially. By carefully toggling the flow of water to be very small, we saw a decrease in the detection frequency, but even this effect was subtle and outweighed by a large amount of noise present in the signal.
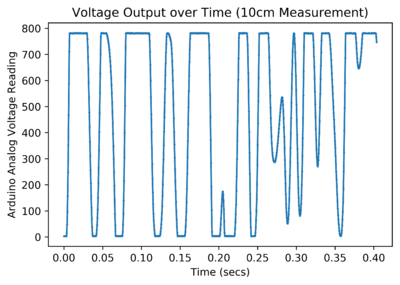
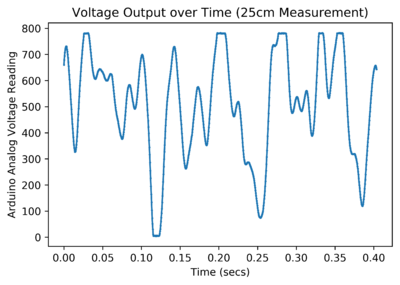
Alternatively, using the pin 1 output of the sensor seemed to give a slightly more consistent correlation between average voltage and the angle of the pipe. With increased distance from the pipe, the average voltage signal strength decreased, but still gave consistently good readings at 25cm away from the pipe.
A problem was encountered with the sensor overheating after a long period of intermittent measurements. At this point, the sensor started giving bogus results. I.e. Giving high frequency detection readings when completely alone in a room. The issue is suspected to be either due to reflections from a large amount of aluminium foil covering the sensor (which was used to block ambient noise), or perhaps from some overheating fault.
7th February 2020
Further experimentation was made with shielding the sensor, which seems to have been causing issues. The sensor was wrapped entirely in aluminium foil and packaged together. The readings from the sensor, contrary to expectations fluctuated and depicted a non-zero motion detection frequency. Even a thin sheet of aluminium reflects microwaves very well, so this result was surprising. After carefully re-packaging the sensor and weighing it down tightly to remove any kind of movement of aluminium foil, the sensor read a consistent zero reading. For this reason, it is thought that even small movements of the aluminium foil un-crinkling could cause significant spikes in the sensor's readings and that if aluminium foil is used for shielding, it will have to be very carefully packaged to avoid any slight movement of the foil. Other thoughts include the possibility of grounding the foil, which in its ungrounded state could yield some unexpected effects. This requires more investigation.
We intend to investigate an alternative circuit for using the HB100 sensor. The Gravity Microwave Sensor is hardwired as a motion detector for human and other physical objects, not water velocity. We'll need a more versatile platform to experiment with in order to develop a sensor for measuring water velocity. For this reason, we will be building a custom circuit.
10th February 2020
Rather than using the motion detector, which has a digital output with non-customizable componentry, a custom amplification and band pass filter was built to communicate with the HB100 sensor directly. In particular, the motion detector is calibrated to detect human motion, and has hardwired components which cannot be modified easily. This is not directly applicable to our application, so we decided to make some changes. We used a new circuit from the documentation for the HB100 sensor. Testing with this new circuit gave more consistent measurements for tracking voltages. There were previously some issues with the motion detector, particularly with the sensitivity toggle giving unpredictable results and picking up noise. Noise seems to have reduced with this new set-up.
11th February 2020
Today, further testing was done with the new amplification circuit. Various methods of extrapolating the velocity signal from the sensor were tried.
The sensor was used to detect flowing water in a PVC pipe (an identical setup to before). The pipe could be angled more steeply to increase the velocity of water flowing through it. With the new sensor, motion could be detected when the sensor was more than 25cm away from the pipe. Readings could be made at around 1m away from the pipe, which is a significant improvement in terms of sensitivity.
After taking the raw data using the sensor, it was post-processed to try and determine the velocity of the water. Several methods were used to do this. The output of the circuit takes the form of an analog signal which oscillates around 2.5V, and clips at around 4V when a large amount of motion is detected.
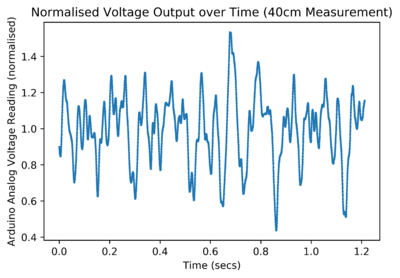
Initially, a peak-counting method was used for the data. This yielded a consistently good result for close measurements; a steeper pipe always had a higher extrapolated velocity reading. For this method, whenever the signal went above 3.9V, it was counted as a peak. The frequency of the signal was extrapolated from that which allowed velocity to be calculated.
For data where the sensor was further away from the pipe (even at around 25cm), the sensor couldn’t pick up as much of a signal and the clipping no longer consistently occurred. This meant that the above method would register a lower velocity as distance increased.
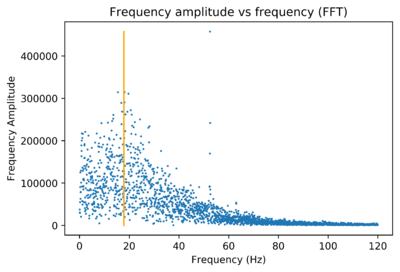
A FFT was used to find the most dominant frequency of the data and that was used to find the velocity. Two different methods were used to find the dominant frequency.
For one method, the maximum frequency point was used and simply assumed to be the dominant frequency. For the other method, the amplitudes of adjacent frequencies were summed together in bins, and the largest bin was chosen as having the dominant frequency. These gave different measurements for the behaviour of the FFTs. Below, the orange line indicates the ‘bins’ method for finding the dominant frequency.
The maximum frequency point, in this case, is a 50Hz outlier which we assume corresponds to noise from mains wiring. This noise has quite a substantial profile particularly when signal strength decreases with higher pipe-sensor distances. Mains noise may be a problem if an FFT is not used to find velocity. This may require more investigation. The maximum frequency point method can nonetheless be used when the amplitude of the signal is strong with smaller pipe-sensor distances.
These methods involving the FFT worked more consistently for larger distance measurements, but there was still too much variation in the FFTs which yielded unpredictable results. It appears as though the hardware needs improvement instead.
12th February 2020
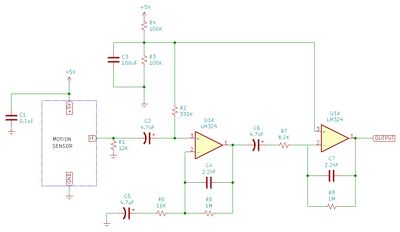
The IF terminal of the HB100 sensor outputs the doppler signal with very small amplitude. It has a constant -70mV signal which fluctuates by around 50mV when motion is detected by the sensor. The new amplification circuit uses two band-pass filters set-up in series.
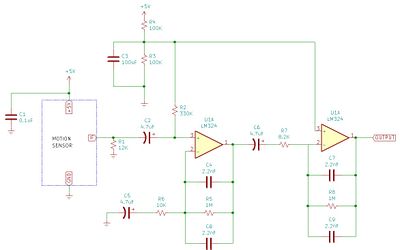
Extra componentry helps regulate the amplified voltage of the IF terminal to a DC signal of 2.5V and helps reduced noise generated in the circuit. The band-pass filters are set to have edge doppler frequencies 3Hz and 72Hz, which corresponds to velocities between 0.05m/s to 1.0m/s. Despite this, the filters have a very shallow decay slope so velocities which are outside this range can still be measured. Thus, these filters were slightly modified to use a narrower frequency band which would allow us to remove more noise from the signal. The amplification of the op-amps was also increased to see if this would result in consistent clipping of the signal over a longer measuring distance, which would allow for the initial peak-counting method to be used. This seems to have given better results for the peak-counting method, but unfortunately, the noise signal was not reduced substantially enough by the band-pass filters to allow us to amplify the signal further for larger distances. The amplification from the sensor was reduced back to the documentation circuit. The narrower frequency range from the band-pass filters seems to have made a positive impact on measurement accuracy, so this change will be used for further testing. The circuit we will be using subsequently is shown below. Note that the capacitance in the band-pass filters has increased, such that the doppler frequency range is between 3Hz and 36Hz, which corresponds to velocities between 0.05m/s to 0.52m/s.
13th February 2020
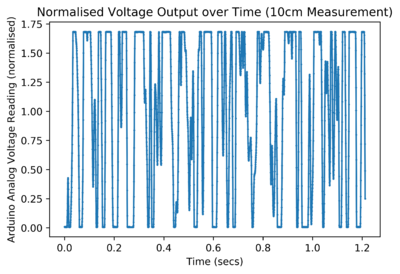
A new method was devised for post-processing the raw data. The signal from the circuit was normalised and all peaks that are higher than a threshold normalised voltage were counted as using the peak-counting method to find velocity. For the closest measurements, 1.4 was used as the threshold normalised voltage, which gave velocities that increased with increasing pipe steepness. For other distances from the pipe, a good qualitative comparison between pipe angles was also observed using a lower threshold normalised voltage. The threshold voltage had to be reduced, as with longer distances from the pipe, the spread of normalised voltage readings actually decreases as well. With appropriate calibration, this means we can measure velocity differences for constant pipe-sensor geometries. Further experimentation can be made with calibrating for different distances/angles between the pipe and sensor.
Distance, angle, mass flow rate and water velocity all contribute to the sensor giving variable readings. Noise is also quite substantial from power outlets, even when no human movement is detected, which can throw off readings and give misleading results. Further experimentation will have to heavily regulate all controlled variables to isolate the water velocity reading.
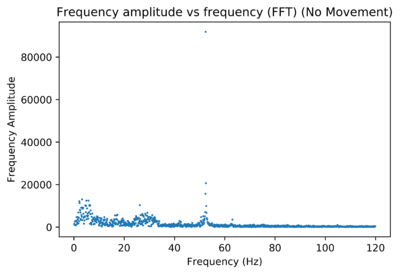
The noise signal from the sensor circuit in an empty room with no movement was more carefully analysed. An FFT shows that there is a substantial 50Hz noise frequency.
The narrowing of the band-pass filters reduced the noise amplitude, as was seen in the FFT. Meanwhile, this left no noticeable changes to the signal strength. The new method was adapted to count all peaks with a threshold voltage reading of 1. This would mean that the standard deviation of the signal strength (which changes with water-sensor distance) could be ignored. Taking these results gives velocity readings which don’t fluctuate much with water-sensor distance, but seem to lack precision due to the 50Hz noise. If 50Hz signals could be isolated, then this method could have promising results. Unfortunately, however, this would mean that water flowing with a doppler shift of 50Hz (which corresponds to 0.7m/s) wouldn’t be possible to measure. This will be explored further.
A better set-up with a small flume will allow us to explore the behaviour of the sensor when the water velocity-sensor angle changes. Beforehand, sensor angle was merely a controlled variable, but now it can be properly explored.
17th February 2020
More theory was done on the sensor. Previously, the angle of the sensor relative to the water flow was kept constant to avoid dealing with the additional variability due to changes in angle. The relative magnitude of water velocity measurements should be preserved by this assumption.
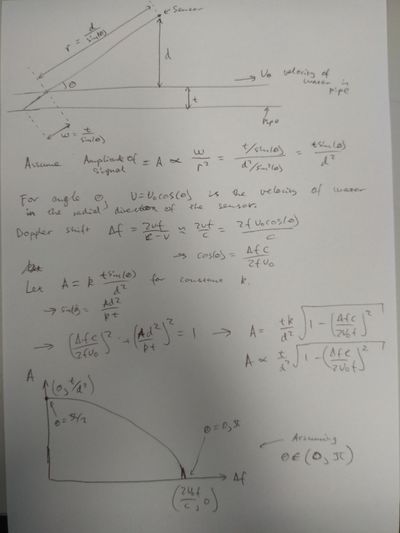
Today we delved a little into the angular variability:
This theory indicates that the end of the Fourier Transform peak rather than the top of the peak is more significant as a gauge of flow velocity.
More testing was done in the small flume. The water flowing in the flume was adjusted to have a constant height along the direction of flow. Given that the water volume flow rate through the pipe is constant, the height of the flowing water should be inversely proportional to the velocity of the water.
Due to the small amount of water in the flume, inserting the (rather bulky) FloMate probe into the water disturbed the flow. Only one velocity measurement was needed to determine the water velocity for all water heights. A large velocity was used to take this measurement, as with lower velocities the probe disturbed the flow more. The velocity of water was approximately 1.1m/s when the height of water in the flume was 16.5mm. This measurement is probably quite unprecise, but any mistake in this value simply means the calibration factor will be wrong, and won't affect the relative magnitude of velocity measurements for different water heights.
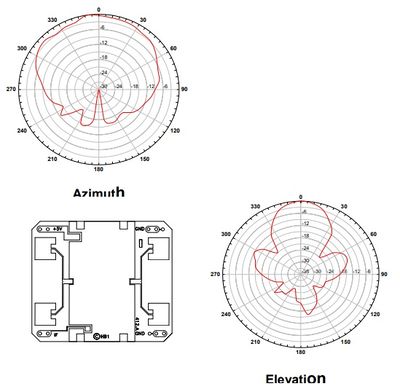
The sensor was placed on top of the flume and rotated such that the more or less stable-signal-strength-angles -60 to 60 degree in the azimuthal direction pointed at the water. This gives the closest possible link between to the theory, which assumes that the signal is stable across all angular directions.
Source: https://www.limpkin.fr/public/HB100/HB100_Microwave_Sensor_Application_Note.pdf
The height of the flowing water was varied and the sensor data was taken whilst ensuring that the sensor did not move. The end of the peak for all the heights was approximated by eye. This gave a good qualitative correlation between doppler frequency at the end of the peak and velocity. However, the approximated end-of-peaks doppler frequencies undoubtedly had a large degree of error in them.
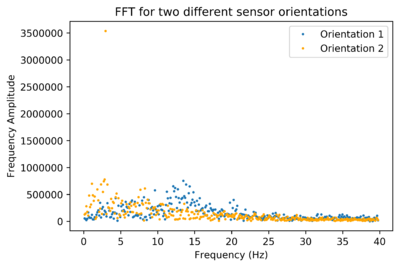
Subsequently, measurements were taken for the same water velocity but with varying sensor positions. It was found that the angle of the sensor significantly affected the position and distribution of the peaks. For example, the following graph depicts two sets of measurements in between which the only change was that the sensor was rotated by 90 degrees.
Here is the same graph but with the data for orientation 1 shifted up (for improved visibility)
This shows that due to the different sensitivities for different angles, the sensor most likely produces a peak based on the direction it is facing. I.e. If the rather pointy sensitivity maximum from -20 to 20 degrees in the elevation direction are pointed at a particular section of water, then the Doppler shift frequency of that water will be very strongly exaggerated in the FFT.
Using a peak-counting method to determine the velocity of these two orientations also gave vastly different results.
