In Water Vel Sensor
This section documented our journey to develop a low-cost water velocity sensor based on doppler effect!
Contents
- 1 20th November 2019
- 2 21th November 2019
- 3 25th November 2019
- 4 26th November 2019
- 5 27th November 2019
- 6 28th November 2019
- 7 29th November 2019
- 8 3rd December 2019
- 9 4th December 2019
- 10 5th December 2019
- 11 9th December 2019
- 12 12th December 2019
- 13 16th December 2019
- 14 19th December 2019
- 15 22nd January 2020
- 16 3rd February 2020
- 17 4th February 2020
20th November 2019
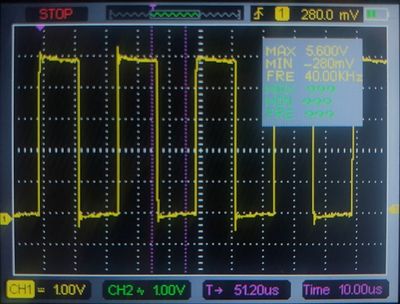
So the first task we are going to try is to use Arduino to generate 40 kHz square wave and emit that signal by using a ultrasonic transducer.
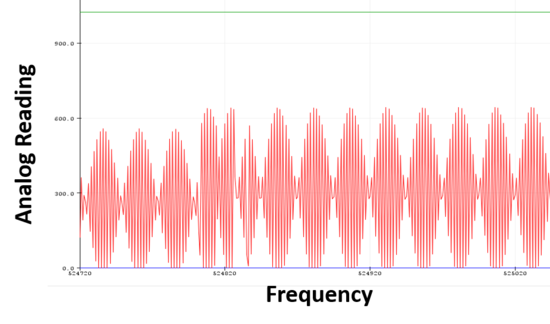
By facing another same transducer to the one emitting the ultrasonic signal, we can successfully detect that signal.
Figures below show the generated square wave from the emitting transducer (measured by an oscilloscope), and the detected wave signal from the receiver transducer (by using AnalogRead).
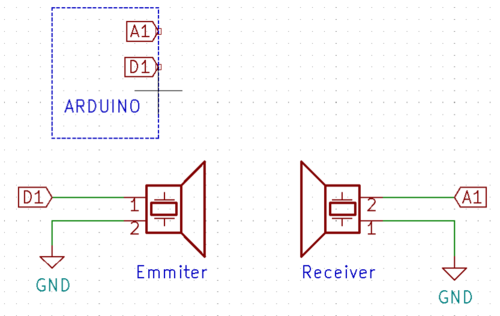
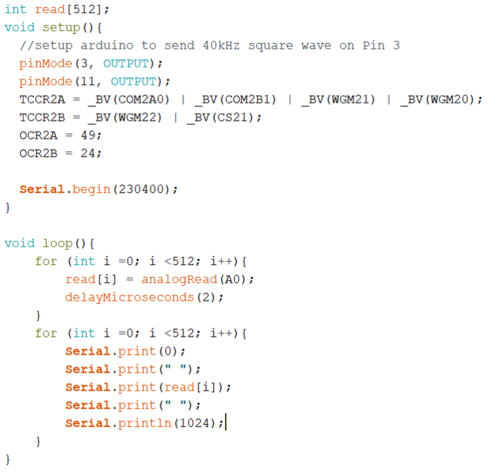
The figure here shows how we wire up the transducers with Arduino to conduct this quick test. The code we used is also attached here to show you how to use Arduino to generate a certain frequency.
21th November 2019
What are we going to try today is to place the two transducers next to each other and facing the same direction.
One emit the signal to a metal wall, and the receiver to detect the signal bounce back.
Multiple op-amps will be used to strength the signal to make it strong enough for Arduino to detect.
25th November 2019
For the arduino to effectively read the low amplitude high frequency signals it is going to need some assistance via external circuitry.
We tested an non-inverting op-amp design based on the LM324. This proved to have challenges reproducing the high frequency signals and after some diagnosis, we determined that the slew rate of the LM324 was too low.
The image above shows the limited slew rate experienced from the LM324N. In this domain the waveform appear as linear as the OpAmp attempts to match the proper signal. It demonstrated a slew rate of about 0.5 V / μS. To overcome this we will need to replace the LM324N with a better OpAmp.
By default the Arduino ADC sample frequency is rather slow at 45 kHz. For our application we will need much faster sampling rates. Fortunately, the clock divider which the ADC runs on (default 32x) is user settable. In testing various values for this, a sample rate of 615 kHz was able to be achieved. <1>
This was accomplished via the following code:
26th November 2019
We tested out some LM883N and NE5532AP OpAmps to see if they performed better than the LM324 (they have a slew rating of ~5 V / μS so they should). Both worked much better than the LM324 being able to reproduce the waveform however, we found that the NE5532AP was better at higher gains.
It was found that the circuit below performed well at amplifying the AC signal of the receiver resonator.
The gain can be adjusted through resistors Ra and Rb via the formula: Gain = 1 + Ra/Rb
Issues were faced where very high noise was present on the output of the op-amp. Some investigation revealed that this was due to the same Arduino driving the 40 kHz squarewave as powering the op-amp. This limited the ability to receive low amplitude signals and made it difficult to detect the reflected ultrasonic waves. A temporary solution to this was to use separate Arduinos for the transmitted and receiver.
A noise profile was obtained by having the ultrasonic receiver covered and placed such that no ultrasonic frequencies would be measured by it. The op-amp output was then measured. Below are the measurements for the two-Arduino setup vs the one-Arduino setup.
The noise is improved in the two-Arduino setup however there is still a significant ammount, it may be necessary to make a PCB with better noise isolation for test which require higher sensitivity.
Arduino Sample Frequency
<1> From doing more test it appears that not all Arduinos are able to sample at the 615 kHz rate, a more reliable max appears to be 215 kHz.
Testing the values of the clock divider registers ADPS2, ADPS1, ADPS0, the following table was made indicating about the various sample frequency on a 16 MHz 5 V ATmega382P (Arduino Uno).
| ADPS2 | ADPS1 | ADPS0 | Sample Frequency (kHz) | Working |
|---|---|---|---|---|
| 0 | 0 | 0 | 325 | No |
| 0 | 0 | 1 | 325 | No |
| 0 | 1 | 0 | 215 | Yes |
| 0 | 1 | 1 | 125 | Yes |
| 1 | 0 | 0 | 66 | Yes |
| 1 | 0 | 1 | 35.6 | Yes |
| 1 | 1 | 0 | 17.6 | Yes |
| 1 | 1 | 1 | 8.9 | Yes |
Arduino Frequency Measurement
To measure frequency an DFT was performed on a 128 size sample at 215 kHz of the amplified ultrasonic receiver signal.The sample frequency was chosen as it was the highest stable, and the sample size as this was the limit of the ATmega382p's memory.
The y-axis height represents strength of that component frequency, and the x-axis the frequency bins, where eight bins corresponds to 1.7 kHz
Concerningly the peak height is at about 90 kHz, and the predominant frequency when measured with an oscilloscope is 40 kHz.
27th November 2019
Some thought was conducted into the feasibility of direct frequency measurement using the ATmega328p and extracting the Doppler shift digitally.
The velocity is given by the equation: v = c/2 (fd/f) cos(θ), where c is the speed of sound, fd is the Doppler shift, f is the emitted frequency, and θ is the angle between the flow and sensor.
Let us assume that the sensor is parallel to the flow (θ = 0). By Nyquist-Shannon sampling theory, to detect a frequency at f we need the ATmega328p to sample at 2f. Applying a DFT to this sample gives a frequency resolution Δf of 2f/N, where N is the number of samples. Therefore, making the substitutions fd = 2f/N, θ = 0, we get: Δv = c/2 (2f/(f*N)) = c/N
For water (c = 1500 m/s) and a velocity resolution of Δv = 0.1 m/s this implies that 15 000 samples would need to be taken. This would require an amount of memory well beyond the 2 kB of the Arduino (which can realistically only store 128 samples).
This implies that direct measurement of the Doppler shift is not feasible and that some signal pre-processing is necessary. The idea is to extract the Doppler shift so that we can have a easier time sampling the lower frequency Doppler shift signal.
There are two approaches which we are going to trial, amplitude demodulation, and a heterodyne converter.
Amplitude Demodulation
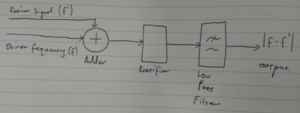
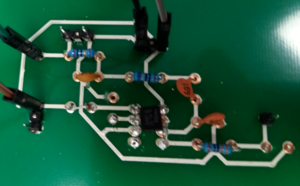
The premise of the AM demodulator is that the sum of the two signals produces a beating frequency (f' - f) which is conveniently also the Doppler shift fd. The rectifier eliminates the negative peaks of the resultant sum, and the low pass filter blocks the high frequency carrier wave of the signal, leaving only the low frequency Doppler shift.
The draw back of this method is that the signal is very weak, and it is difficult to scale to higher frequencies.
A pathfinder version of this circuit was constructed as indicated in the diagram. The inputs were provided by two Arduino Unos with one generating a 40 kHz 5Vpp Square wave, and the other a 43.4 kHz square wave. The output as measured by an oscilloscope was good, displaying an about 3.4 kHz wave which was the difference in the two frequencies. The output was however, a bit noisy, and low in amplitude (~500 mV). Building this on a proper PCB should help eliminate some of the noise and allow the output to be amplified.
The 43.3 kHz Arduino was then disconnected from the circuit and the ultrasonic transducers were wired into the circuit, (with some appropriate changes to the resistor values). The transducers were then placed so that they were facing each other and then the receiver was moved back and forward at a steady rate. The output of the demodulator was able to detect the Doppler shift and thus this motion, however much noise was present and the signal was weak.
Heterodyne Pre-Processing
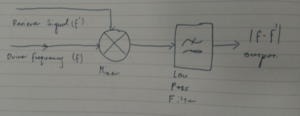
The Heterodyne is more standard for high frequency Doppler shift applications, the mixer multiplies the two signals. For two sine waves with frequencies fa and fb, their product will be the sum of cosines with frequencies |fa-fb| and |fa + fb|. For fa = f', and fb = f, the lower frequency signal is the Doppler frequency, which can then be isolated from the higher frequency using a low pass filter. This method provides the advantage of it being proven to work at a wide range of frequencies, in excess of 500 MHz.
28th November 2019
Following on from yesterday, I tested to see if the Arduino could analyse the output of the AM demodulator circuit. The output of the circuit was connected analog pin A1, and the below code was run.
The code, generates a 40 kHz 5 Vpp square wave on pin 3, then samples at 100 Hz on pin A1 for 128 samples. This data is then passed on the arduinoFFT library when does a DFT on the data to convert it into the frequency domain. The frequency domain data is then plotted to serial.
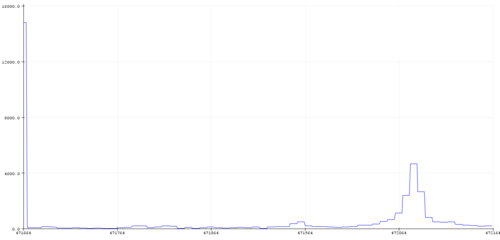
Running this code while moving the ultrasonic sensor at about 4 cm/s. The FFT in the gallery was the output.
The peak is seen at about bin 10. The bin frequency is given by fb = fs/N, where fs is the sampling rate (100 Hz in this case) and N the number of samples (128). This gives a bin frequency in our case of 0.78 Hz. As we are interested in bin 10, our Doppler frequency is 7.8 Hz.
Using the formula: v = c/2 (fd/f) => v = 340/2 (7.8/40 000) => v = 3.3 cm/s
Which is within our margin of error for the velocity, and indicates that the principle behind the sensor is as observed.
AM Demodulator PCB
PCB drawn up to take the AM demodulator off the breadboard and hopefully reduce some noise. Off to the Voltera!
Note: C1 was changed to from 1 μF to 100 nF as it had better performance.
The circuit works well, much the much better noise floor creates greatly improves the signal to noise ratio. The signal is still a bit weak however some more amplification may help this out. An oscilloscope is able to detect the Doppler shift when the transducers are facing each other and one is moved from about 1 meters distance, and from about half a meter when the signal is bounced off a wall. It is hoped that optimization of the values of the components can improve on this.
Additionally, it still needs to be tested if the Arduino can detect the signal from this.
When the traducers are facing each other, the Arduino is able to read the voltage and perform the analysis on it. Below is an FFT plot from the Arduino in this arrangement.
Wrote some code to use the frequency data to determine the speed. Initial tests indicate its working well, although a proper trial with calibrated speed references will be necessary to be sure if its working properly.
29th November 2019
Some tuning was done to the AM demodulator circuit to improve performance. One issue found when probing with the oscilloscope is that the output of the opamp was being clipped as the amplification was too large, and so the resistor R6 was changed to 5 kΩ to prevent this.
3rd December 2019
Some testing was done into if it would be possible for an Arduino to produce a 1 MHz frequency, which will be needed if we want to switch to a 1 MHz transducer. It was able to generate the waveform, however, significant ringing did occur on the rising and falling edge. This may be able to be alleviated with a capacitor if it becomes an issue.
Heterodyne Circuit
In order to switch to using higher frequencies the heterodyne circuit topology is going to be needed. A circuit based on the SA612AD is going to be build according to this schematic.
Building this circuit, it seems to perform effectively, and with a output signal much cleaner and stronger than the AM demodulator. The waveform in the gallery was taken with the two 40 KHz ultrasonic sensors pointing towards a wall about 30-50 cm away. The amplitude of the signal being about 80 mV should be able to be detected by the Arduino, however if not the output signal is SNR is low enough that amplification could be done. Furthermore, it seems as though the low pass filter has a much easier time of isolating the low frequency component of interest when compared to the AM modulator, another benefit of this design.
For two 40 KHz ultrasonic sensors facing each other at about a half a meters distance, the Arduino was used to record the output of the Heterodyne Circuit. The FFT of the signal is shown below. It is seen that the signal produces a much more distinct peak at the Doppler frequency, which will help the extraction of the velocity from this output.
In investigating the SA612AD, the two RF inputs IN_A and IN_B can be used to form a ballanced line. Connecting either side of the Ultrasonic transducer to a these pins through a 100 nF series capacitor, reduces the noise which is introduced into the amplifier, and so improves the sensitivity of the circuit.
1.7 MHz Tranducers
Having success in measuring the Doppler shift at the lower frequencies, it is time to test out the higher frequency ultrasonic transducers.
The specific piezoelectric disk which we going to be testing is: https://au.mouser.com/ProductDetail/PUI-Audio/UB161M7?qs=pFWzdYhrkoc8QGl1JZ231g%3D%3D
It has a rated resonant frequency of 1.7 MHz, however the Arduino is only able to produce frequencies an integer division of its clock frequency (16 MHz). It was found that out of the frequencies which the Arduino could generate (16 MHz / 9 = 1.78 MHz) produced the largest resonance in the ultrasonic transducers.
These disk do not come with any wires soldered to them and so this needed to be done manually. Something which was quite difficult as the solder contacts ideally should be quite small.
In modifying the above Heterodyne circuit for use with the 1.7 MHz tranducers, I found that the grounding on the breadboard is not good enough for a low noise output. I might have to make a PCB for it, or add better grounding.
The noise was not able to be solved easily, and so a PCB is going to be made.
4th December 2019
Little success was had with the PCB, the higher frequencies of the 1.7 MHz tranducers results in many more complications in the circuit design. Additionally, with the multiple problems present it is difficult to isolate and diagnose how each part of the circuit affects the overall performance.
In testing the circuit works well at 40 KHz, better heterodyne circuit built on the breadboard. As the IC is rated for operations up to hundreds of MHz, this narrows down the source of the issue to be either, the ultrasonic tranducers, the signal integrity, or the values of some of the components being unsuitable for MHz work.
Transducer Resonant Frequency
I measured the resonant frequency of the two 1.7 MHz traducers using the oscilloscope. The values were quite a bit off from 1.7 MHz with one being 1.64 MHz and the other 1.63 MHz. It is likely that this shift is because of the wires which needed to be soldered on to the traducers. This shift could also be one of the reasons that the circuit is working.
In re-reading the datasheet and conducting some testing on the tranducers, they are a type of transducer known as a bender. This type is more suited towards high voltage application 10s of Volts, and is not suited to detecting small pressures as are those found in ultrasonic air waves. These tranducers do not have the characteristics necessary for our application, and so hopefully the ones in the post are better.
1 MHz Transducer
I had a bit of a test with the 1 MHz ultrasonic tranducer: https://www.digikey.com/product-detail/en/unictron-technologies-corporation/H2KLPY11000600/2047-H2KLPY11000600-ND/9921487, to see if it was able to detect a reflected signal.
The setup was to send 20 1 MHz pulses to the transducer and then use an oscilloscope to monitor if any reflected signal was present.
In air this was not able to be done. Varying the distance didn't seem to help either no reflected signal ever being detected in the osciloscope.
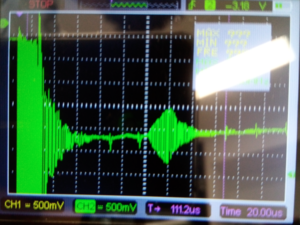
In water however, the results were quite successful. The waveform attached is of the transducer facing down into a cylinder of water about 15 cm high, the surface of the transducer was touching the water. As can be seen the reflected waveform produces a distinct peak, some time after the driving pulse is stopped.
The reason that the trial in water worked, whereas the one in air didn't is probably to do with impedance matching. That is at higher frequencies, much less of the vibrational energy gets transferred from the tranducer to the low density and slow speed of sound air than compared to the more dense and higher speed of sound water. This is something which we will need to pay close attention to as we wish to maximize the amount of energy that gets transferred into the medium, so we can have an easier time detecting the reflections.
5th December 2019
We found some new 1 MHz ultrasonic transducers, and they seems to be more suited towards transducer application: (https://www.steminc.com/PZT/en/piezo-ceramic-disc-10x2mm-r-215-khz-wire-leads-smd10t2r111wl).
I tested the resonant frequency and found it to be the quoted 1 MHz.
Good news! The transducers are transduceing, that is to say, using the oscilloscope you can detect the oscillation of the driven transducer with the receiver transducer. It is important to note here that these tests were done in water as in air the coupling is too weak.
The tranducers also seem to have a resonant frequency at just undre 250 kHz, about 243 kHz. This one actually seems to be stronger, with more signal being transduced at this frequency.
The reflected pulse off the bottom of a cylinder of water was not able to be measured by this transducer, as with the previous 1 MHz transducer.
In doing some preliminary testing, it is looking like all of the MHz tests are going to need to be conducted in water. Additionally, it appears as though the container shape matter as the ultrasonic waves tend to reflect off the walls and create resonances in the cylinder, this interferes with the signal.
With some adjustment to the capacitor C? from 68 pF to 170 pF, I was able to get a signal out of the Heterodyne circuit when both of the transducers were facing each other. The signal was weak and still had a significant 250 kHz component, but it was able to be measured with an oscilloscope.
9th December 2019
Some new ultrasonic transducers arrived. They are already enclosed and wired up so they look more promising than the other ones.
I used the function gen and oscilloscope to get a precise reading on the resonant frequency in air and it is about 1.018 MHz. This value was obtained by finding the local minimum in amplitude across the traducer, with a series 330 Ω resistor, when sweeping through the frequencies using a function gen.
In water the resonant frequency was 0.999 MHz, which is within the measurement error for the manufacturers quoted 1 MHz
I conducted another test in which I applied a 1 MHz frequency to one transducer in water and measured the voltage across another transducer with an oscilloscope. A few good things to note from this was that more voltage across the input transducer produces a stronger signal on the output transducer. The relationship is not exactly linear but it is fairly proportional, with diminishing returns occurring at larger voltages. Also, the arrangement of the transducers is very important, they need to be facing each other or have a good path through a reflection off a wall. Otherwise the signal is almost undetectable.
I hooked up the transducers to the Heterodyne circuit with the Signal Gen providing the 1 MHz input wave. Using an oscilloscope I am able to detect the motion of the transducers. The signal is very weak and still superimposed with the 1 MHz input wave so I am unable to upload a meaningful image of it yet.
Passing the signal through a low pass filter (f = 4.5 kHz), the doppler shift becomes much more visible on the oscilloscope. In this setup the transducers were placed such that the wave reflected off the bottom of a cylinder of water. The input wave did have to be increase to 9 Vpp, however this can be reduced later once the circuit is tuned correctly. Attached are two images one of the output when the receiver is still and one when it is being moved very slowly, (> 1 cm/s). The Doppler frequency is clearly visible when comparing these two, I suspect that the low frequency wave in the no motion waveform is an artifact of the oscilloscope.
At this point, the circuit-transducer combo is quite well tested, and it is time to look at getting a proper PCB manufactured and encasing the transducers.
12th December 2019
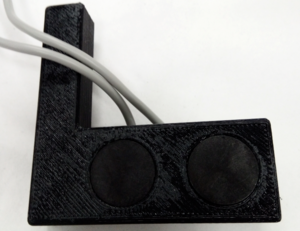
A housing was printed for the ultrasonic sensors to keep them well aligned and as a prototype for the final packaging of the sensor.
16th December 2019
A schematic for the PCB was drawn up. It features an onboard 1 MHz clock generator to provide the stable 1 MHz signal needed for the Tranducers, and it outputs the low frequency Doppler shift.
A rendering of the PCB is also shown in the gallery.
19th December 2019
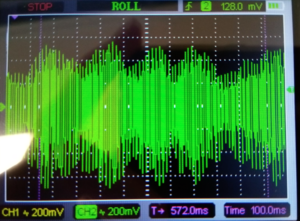
The heterodyne circuit and the 1 MHz tranducers were tested in the 3D printed casing in a water sink. The output was very good for movement of the sensor, (photo in gallery), with the signal being many times the noise level. Granted, this was with a input voltage of 9 V, but this would be able to be reduced in the future.
Motion of the water, however, proved to be more difficult, it was generally undetectable, expect for very fast velocities. The signal to noise amplitude ratio never exceeded one. This domain is the one we are interested in to measure the fluid velocity, so much more optimisation of the design will be needed if the signal is to become Arduino readable. It is noted that tap water was used to fill the sink, which lacks the particles necessary to get a good reflected ultrasonic signal. It is presumed that in storm-water their will be more particles present so this will help in making the signal stronger.
The water velocity signal was too weak to get a useful screen grab from the oscilloscope.
22nd January 2020
The new PCB designed to reduce noise and enable a higher sensitivity reading was soldered and tested today. The noise floor for a 5 V 1 MHz Arduino generated square wave was about 20 mV. When tested in water the Doppler shift off a hard surface such as the sink wall was able to be clearly detected, however no signal was had with just the flowing water. The J4 output was much worse performing than the JP1 voltage point. This is likely due to the ground noise making the low pass filter (C8, R11) ineffective. The balanced line amplifier has not been tested yet so it is still to be seen if this method produces a cleaner output. Grounding the EMF shield of the Doppler transceivers had little effect on the noise performance of the device.
Switching from a driving signal generated from the Arduino to one generated from the integrated oscillator, the noise floor dropped to below 5 mV, a substantial improvement. However after the traducer was plugged in the noise increased substantially. Reflections were still able to be detected off hard surfaces. Tests as to whether it could detect flowing water were inconclusive. This time the (C8, R11) low pass filter did help improve the signal quality. At this point I am thinking that the much increased noise level has to do with the much lower impedance of the transducer when compared to the open circuit, thus requiring larger current draws from the oscillator and creating more interference. One possible method of trying to overcome this is to not use the direct signal from the 1 MHz square wave oscillator to drive the transducer but instead to take the first pass it through the low pass filter system which produces a sine wave for pin 3 of the mixer and then amplify that using the unused channel of the op amp. This should work better as the sine wave does not have any higher than 1 MHz harmonics like the square wave does and so the amplification of this signal should produce less interference.
After testing amplifying the sine wave works to reduce the interference of once the transducer is plugged in. However the problem is now that the op-amp selected does not have a high enough gain at the 1 MHz signal. A gain of around 25 would be desired. The NE5532 used can only achieve a gain of 4 or 5 at this frequency. The two best options to overcome this would be to look for an op-amp which has better characteristics at this frequency or to implement a two stage amplifier in which the output of one op amp is fed into the next.
Testing this setup in water it seems that the 1 V signal from the single NE5532 is still strong enough for the returned signal to be measurable. Due to the low noise the signal is now very clean and easily readable, so it is worth considering whether the driving voltage for the transducer needs to be amplified more or whether it is good as is. Water velocity flow is still unable to be detected. The signal off the reflection from water is at least several times weaker than hard surfaces, and it is hard to get a consistent flow of water in the sink I was using so it was difficult to see whether the signal was due to the flow of water or just random noise in the circuit. Having a large steady flow of water in some test apparatus would help with this, as would using the balanced line amplifier on the circuit to get a better resolve the small signals.
3rd February 2020
Analog characterisation of the heterodyne circuit
The heterodyne circuit was tested for its analog performance using the following circuit
The circuit was powered on and then the function generator was used to imitate the return signal from the receiving ultrasonic traducer. First the frequency of the function generator outputting a 100 mVpp sine wave was tuned such that the frequency matched that of the in-circuit oscillator. This frequency was found to be about 1.000 32 MHz +- 1.000 01 MHz. From here frequency was shifted up to 1.000 350 00 MHz to produce a signal on the output of the circuit, a frequency which roughly corresponds to a flow velocity of about 2 cm/s. The amplitude of this signal was measured with the oscilloscope. This method produced the graphed relation between input signal amplitude and output signal amplitude.
From the graph it is seen that the noise floor is about 20 mV however voltages as small as 5 mV are still able to produce a distinguishable signal. The device has good sensitivity to small input signals and amplifies the input with a gain of about 3. The voltage produced by a ultrasonic receiver in water has not yet been tested, however it is likely to be quite small, so any performance improvements achievable here would be welcome. To feasibly measure the signal with the Arduino the voltage amplitude needs to be on the order of 10s of millivolts ideally greater than 50. To accomplish this the on-board amplifier will now be activated and the device will be retested.
The in-circuit amplifier turn out to be difficult to get working. Issues with the design of the amplifier lead to it being very unstable with positive feedback loops oscillating the signal between both supply rails. An amplifier more suited towards amplifying the balanced line output of the SA612AD and should be implemented on the next revision of the PCB. The new amplifier only has 20 dB/decade roll-off however this should be sufficient to filter out the 1 MHz carrier from the 100s Hz signal.
Other design ideas which could be implemented to help out with the signal acquisition could be to use the Aref pin of the Arduino to feed in a 100 mV signal, thus making the range of the ADC smaller and the measurements more precise. Another idea is to add an independent I2C ADC onto the velocity circuit board. This has the advantage of using fewer wires in the cable and also dose not need to analog signal to travel the long distance up the cable where the signal quality would be degraded due to interference.
The signal was connected to an Arduino and an FFT was taken on the data (N = 128, fs = 1000 Hz). The arduino was easily able to detect the frequency shift of a 1 mV signal input into the receiver ultrasonic transducer. The memory limitations of the Arduino create range restrictions on the data. At a range which would include the flow velocity of 2 m/s the resolution is 0.03 m/s. To overcome this traditionally would require more samples to run the FFT on however as mentioned the Arduino does not have the memory for this. Another more resource efficient solution is to take two reading, one at a higher sample frequency and one at a lower sample frequency. This way the lower sample frequency will have the resolution to distinguish slow flow velocities, and the high sample rate fast velocities.
4th February 2020
The velocity sensor was tested in the flume to check to see if it is able to receive a signal in the water to any extent. The velocity sensor was attached to the flume as shown in the photograph below.
The sensor was originally attached through a 2 m Cat-5e Ethernet cable however this was found to diminish already small signal too much, so the Arduino was connected directly to the Heterodyne circuit. Once integrated and installed in-situ this would be unfeasible and so it is going to be necessary to include a ADC converter on the circuit.
In this arrangement the FFT was able to distinguish a peak at the Doppler frequency of the flow. The peak was very weak and not apparent on all sample readings, however it was present and observed to shift left and right with the changing speed of the water in the flume. When the maximum frequency (converted to water velocity) was printed to serial and compared to a proper water probe the reads showed some correlation with the BoSL sensor being within 50% of the proper probe. The current signal analysis is not good for velocities above 330 mm/s or below 50 mm/s so dynamic sample rate adjustment will need to be implemented to solve this

