PSD Sensor
Contents
Introduction
This page will present the development of the Camera Turbidity and PSD Sensor. More introductions to come...
Development Log
04 July 2022
The very first experiment...
Camera
OmniVision OV2640 Camera, 640*480, JPG output, default camera settings (automatic exposure, gain, and white balance), lens not changed. The camera is connected to a ArduCAM Arduino Shield which is compatible with the Arduino Mega board. The board is set up using ArduCAM's Arduino Library. When taking images, the Arduino Mega is connected directly to the PC, and the images are sent and saved on the PC directly, for now.
Turbidity Solution
The tap water is mixed with natural silts to create the synthetic solution. The turbidity value ranges from 0 to 639 NTU in this experiment.
Methods
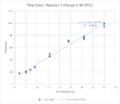
First, put the synthetic turbidity solution into the 3d-printed black container, after measuring the actual turbidity (in the unit of NTU) using the Thermo Fisher turbidity meter. Then, light up the LED (from the top hole of the container lid) and take images (from the side window) of the solution at a 90-degree angle. This light scattering method is a common method used for turbidity measurement. Generally, when the water is more turbid, the increased particles in the water scatter more light beams in directions other than the straight direction, hence the light intensity received from the side directions (such as 90 degrees) will increase. The RGB (red, green, and blue) values of each pixel of the images are obtained using python script and converted into a single value - grayscale (0 - 255, completely black to completely white) using the Luma formula (Y = 0.299R + 0.587G + 0.114B). The average grayscale value of all pixels of each photo is calculated. Finally, plot the relationship between the average grayscale value of each image and its corresponding solution turbidity.
Results
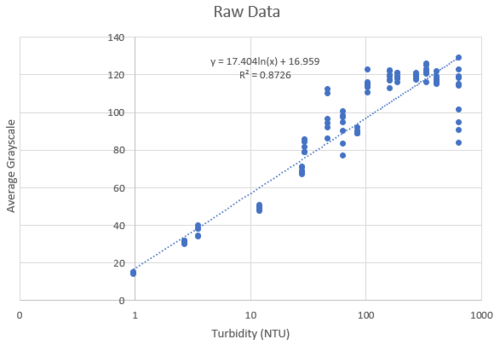
As shown in the plot, there is a linear relationship between the log(NTU) and average grayscale, with the squared-R = 0.8726. However, this result is not good at all, as the grayscale values almost plateau when the turbidity values go above 100 NTU. This may be attributed to the strength of the LED. To be more specific, the light intensity of the LED is too strong, hence when the turbidity reaches a certain value (more than 100 in this case), the particles in the water have already scattered too much light that the camera is not able to handle. Therefore, in future experiments, the LED intensity should be lowered. Another issue of this experiment is that the silts are so heavy that they settle down very quickly, thus the actual turbidity of the solution may also change quickly. Moreover, the container design should be improved so that the camera can be placed in a relatively fixed position near the "window".
10 August 2022
The second experiment with a great number of changes.
Camera
Camera changed to OmniVision OV7675 Camera for better documentation, size changed to 320*240, format changed to BMP output, camera setting changed (automatic exposure, gain, and white balance are disabled), lens not changed. The connection and software of the new camera remain the same as previous one.
Turbidity Solution
To overcome the problem that the settlement of turbidity particles is too fast, the standard turbidity solution is used this time. 4000 NTU Formazin turbidity standard solution and DI water are used to make standard solutions with the following turbidity values: 0 (pure water), 25, 50, 75, 100, 200, 300, and 400 NTU. The actual turbidity of each solution is measured and differs from the "standard value". The actual turbidity values are used in the plotting.
Methods
Most of the processes remain the same with the following few exceptions. (1) The 3d-printed container design is improved, so the camera can be placed in a relatively fixed position. (2) In the previous experiment, the software provided in the ArduCAM library is used to take and save images. But this time a Python script is used to obtain the images, hence we can set the image format to bitmap (BMP). (3) Most importantly, the white LED used for the experiment is tested with 3 resistors (20, 470, and 4700 ohms) which can provide different levels of light intensity (strong, moderate, and weak).
Results
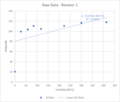
High Intensity: If we look at the turbidity estimation ranging from 0 to 400 NTU, the LED with full brightness is not ideal, as there is no correlation found. However, the hypothesis is that high-intensity LED may be useful when the turbidity is in a low range, and the strong scattered light may be sensitive to the change of turbidity in that range. Further experiments are needed to test this hypothesis.
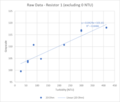
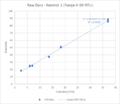
Moderate Intensity: The average grayscale values for 300 and 400 NTU are almost the same, the assumption is that the detection limit is also reached for this level of LED intensity. Excluding 400 NTU, we are able to find a good linear relationship (R2 = 0.9837). And surprisingly, the range below 100 NTU shows a nearly perfect linear relationship (R2 = 0.9994).
Low Intensity: Although the images taken are extremely dark and I could not distinguish them using naked eyes, the linear relationship looks not bad (R2 = 0.9641). It appears that the linear relationship for the NTU ranging above 100 looks better (R2 = 0.9891). A consistent hypothesis is that, with the low LED intensity, the camera may be able to estimate the very turbid solutions. Further experiments are needed to test beyond 400 NTU.
19 August 2022
The completely replication of the previous experiment.
Camera
Same as the previous experiment.
Turbidity Solution
Same as the previous experiment. The turbidity solution is the one used in the previous experiment, but the actual turbidity values are all re-measured.
Methods
Same as the previous experiment.
Results
The results are very consistent with the previous one and prove the repeatability of the experiment. The squared-R values of the linear relationships in this experiment are slightly decreased, but the decrease is not significant. Nevertheless, the moderate-intensity LED shows a nearly perfect linear relationship for the turbidity values ranging from 0 to 100 NTU, again.
These two experiments are conducted based on the standard turbidity solutions to avoid the issue of fast settling of the particles, but this is only a temporary solution to the issue. In the subsequent experiments, I will change the solution back to the synthetic solutions, while trying to make the measurement more accurate.
25 August 2022
This experiment uses the solution synthesised with air-dry clay (used for DIY crafts).
Camera
Same as the previous experiment.
Turbidity Solution
The solution is changed from the standard turbidity solution to the air-dry clay solution. The air-dry clay is usually used for DIY crafts and is finer than the natural clay and silt. Hence, the finer clay in the solution will settle much less slowly than the natural clay and silt. It makes doing the experiment easier and the results more accurate. The actual turbidity value of the clay solution ranges from 0 to 450 NTU.
Methods
Same as the previous experiment.
Results
Overall: The general trends for the clay solution and standard solution are similar. But if having a closer look, we can see the linear relationships for clay solution are much weaker, and their trendline slopes are also less steep.
High Intensity: The results approve the hypothesis that the LED in full brightness provides sensitive and accurate estimation for a lower range of turbidity value (R2 = 0.9959). Despite the fact that the material of the 3d-printed container is reflective and it may be a factor interfering with the image capturing, especially when the turbidity value is very low.
Moderate Intensity: A strong linear relationship existed for standard turbidity solution at a range from 0 NTU up to 400 NTU. But the strong linear relationship only exists for clay solution at a range from 0 NTU up to 150 NTU. (Figure 5 and figures in previous experiments)
Low Intensity: The results of this experiment are not very ideal due to the outliers at 200 NTU, for an unknown reason. If we ignore the outliers, the overall linear relationship is still relatively strong. Regardless, the sensibility (slope) of the relationship is extremely low (0.0067 grayscale per 1 NTU). According to Figure 6, it is consistent that at this level of light intensity, the images are totally dark when the turbidity value is lower than 50 NTU, and the linear relationship is good from 50 NTU all the way up to 400+ NTU if the outliers at 200 NTU are a pure error.
13 September 2022
This experiment uses the solution synthesised with natural clay, again.
Camera
Same as the previous experiment.
Turbidity Solution
The solution is changed from the standard turbidity solution to the natural clay.
Methods
Same as the previous experiment.
Results
No correlation is found in this experiment. It is later found that too many large particles were suspended in the water and the ones above the level of camera view had already blocked most of the light from the LED. Hence, the camera was not able to capture proper images.
14 September 2022
This experiment removes the large particles which settled immediately and the turbidity range is 0-100 NTU.
Camera
Same as the previous experiment, with the exception that the focus of the camera is adjusted to the position where LED light illuminates from right above. It is noted that the OV7675 camera is a fixed-focus camera, the focus is "adjusted" by screwing out the lens.
Turbidity Solution
This experiment uses the solution synthesised with natural clay, removing the large particles which settled immediately. The range of turbidity in this experiment is 0-100 NTU, aiming to test the sensitivity of the sensor.
Methods
Same as the previous experiment.
Results
This experiment further proves or refines the following hypothesis:
- The high-intensity LED (20 Ohm) provides accurate and sensitive turbidity prediction from 0 to 50 NTU.
- The medium-intensity LED (470 Ohm) provides good turbidity prediction from 10 NTU. Its prediction for solutions smaller than 10 NTU is not accurate and sensitive.
- The low-intensity LED (4700 Ohm) is not able to provide prediction, it should be abandoned or changed to a relatively higher light intensity (smaller resistor) in future experiments. It is still hypothesised that a low-intensity LED can provide prediction in a greater range of turbidity values.
31 Janurary 2023
An image-processing-based method has been proposed for PSD analysis. To undertake a validating experiment for the proposed method, a 3d-printed sample container has been designed: the bottom of the sample container is a transparent plastic plate, and a white LED light panel is put below the plate to work as a backlight for the water sample. A shallow depth of water sample with soil and silt is put into the container, and the sample image is captured by a phone camera from right above. The algorithms to perform the image analysis are written in python script, and the script runs in the following steps:
- crop the image to the area of interest.
- convert the full-colour image to a grayscale image (convert RGB values of each pixel to a grayscale value, ranging from 0-255).
- optional denoising of the image with a Gaussian filter.
- automatically or manually set the grayscale threshold, any pixel with a grayscale value higher than the threshold is considered as a portion of a particle (black) and any pixel with a grayscale value lower than the threshold is considered as the background (white).
- apply the threshold value to convert the grayscale image to a binary image.
- use Connected Component Analysis to count the number of black dots (i.e., particles) and calculate how many pixels build up each particle.
- using the number of particles and sizes of these particles (in pixels), it is hypothesised that the distribution function can be compared to the actual PSD analysis performed by the PSD analyzer.
Today's trial experiment found that the distance between the camera and the sample is too short for the camera to focus well, hence the images are blurred. In the next experiment, the 3d-printed container will provide a sufficient focus distance (~7cm).

