Radar Velocity
This page will be dedicated to a radar velocity sensor.
Contents
27th January 2020
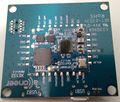
We have ordered some radar sensors from Acconneer, namely the A111, in the XM132, and XE132. And some radar lenses for these.
The XE132 from acconeer comes with pre-compiled binary software, that allow it to connect via micro USB to a computer and create visualizations of the data.
The XE132 was set up as per the user guide, as was the Acconneer portable exploration tool.
Of interest to our application is the sparse short-time FFT visualisation as it allows the speed to be determined at different distances from the sensor. As can be seen from the gallery there is an FFT for each of the 6cm distant ranges, a matrix plot of the velocity-speed readout of the sensor.
Open question which need to be answered for this sensor are of question of how the lens impacts performance, if the Doppler shift of water can be measured, and at what angle to the flow is the Doppler shift successfully measured.
28th January 2020
Today we will test the XE132 in the flume. Just a basic test will be conducted. The radar sensor will be pointed at the flume surface and the short time fft visualization tool will be used to detect if a Doppler shift if present. Different angles and lens configurations will be tested.
It was found that the water velocity was not able to be easily seen with the acconneer radar sensor. It seem that the issue being had is that there is little reflection off the water surface. A wide range of angles were tested. Specifically the velocity was not seen to go above about 0.1 m/s. This was not easily separable from errors such as the water surface level changes.
Following some more tests in the flume it was seen that the high velocity readouts occurred when the water velocity was greatest, hence adding to the hypothesis that the changes in surface height were being measured more than the water velocity itself.
In another test outside the flume, the radar sensor was moved at an angle to the floor and at a constant height. At a 45 degree angle it was seen that the Doppler shift was able to be measured, however with a weak signal, as the angle decreases this signal became stronger in amplitude but the measured velocity decreased until when the radar was pointed vertically, no horizontal movement would cause Doppler shift. This test highlights that a good reflected signal occurs perpendicular to the surface, but a good Doppler shift occurs parallel to the surface.
If this system is going to function, it is needed to test how to achieve a better reflection of water and how to minimise the effect of water surface changes.
In investigating other high cost Doppler radar sensors, they all seem to require a minimum surface ripple height of about 3mm. I have a suspicion that this is because the reflect the Doppler signal off the rising slope of the wave, hence getting a good reflection angle to bounce the signal back to the sensor. These sensors are also quoted as measuring the surface velocity, which further supports this. https://www.mdpi.com/2072-4292/12/8/1296/htm discusses this listing the small surface waves as scatterers. That paper also predicts the optimal size for a 60GHz surface scatterer wave is 3mm. In reflecting on the flume experiment, it the flow was very smooth at some parts, the lack of reading is not explained with the above information.
2nd February 2020
The acconneer XE132 was tested along with the lens kit. With was done in a bath tub filled with water. The aim of the test was to see if the acconeer was able to measure the velocity of waves generated in the tub. To do this a cylindrical object was bobbed up and down propagating out waves which would then travel under the acconeer's measurement zone. The acconeer was mounted about half a meter above the waters surface, and angled at about a 45 degree angle. Hence the water surface was on the order of 1 meter away from the sensor. The results were monitored on an external computer via acconeer's portable exploration tool.
The short time fft measurement tool was used and it was found that the water waves were able to be measured. The waved needed to be of a sufficient size in order for them to be detected, a few millimetres in size as predicted by theory was found to be about right, surface bubbles or other small surface features greatly helped the sensor detect a stronger return signal.
The settings were then optimized, to get the best performance. This was found to be when:
- Range Interval - set as appropriate
- Profile - 3
- Sweep Rate - 2000 Hz
- Sweeps per frame - 32
- Sampling Mode - A (less correlation)
- Repetition Mode - Host Driven
- Down sampling factor - 1
- HW accel. average samples - 32
- Gain - 0.5
5th February 2021
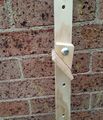
Today was spent developing a testing device to further and numerically verify the performance of the radar sensor. It is a PVC pipe with an attachment point for the radar velocity sensor. This attachment point can vary the sensors height and angle above the water surface allowing the testing of these different parameters. The water will be sent down the PVC pipe where the angle of the pipe can be changed to allow different water velocities. Area in which this test environment is more challenging that an actual installation is that the PVC pipe is a very narrow water stream hence the radar reflection area is much smaller than in a more natural stream.
Images of the test platform can be seen below.
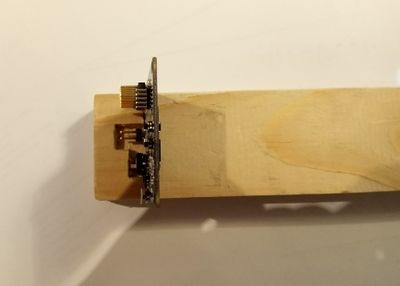
An endcap is attached to the far end of the pipe via duct tape this allows water to build up and increase the water surface height, hence also altering the velocity. The radar velocity sensor screws into the front of the attachment point.
The amount of metal in the design was reduced as metallic object might interfere with the radar beam.
8th February 2021
The apparatus built above was used to test the radar sensor. To do this the radar sensor was attached 800 mm above the pipe and angled at a 45 deg angle of declination. The pipe was inclined at an angle no greater than 5 deg. A hose pipe was used to flow water down the tube. The radar setting were as described above. Initially this didn't work with no reading being detected.
A jet setting was then used on the hosepipe to shoot water just above the pipe. This was able to be detected by the radar sensor with a velocity of about 1 m/s. Again, when this was done just inside the pipe, no reading was given. This indicates that the pipe adds too much attenuation to the signal.
The radar sensor was then lowered to 400 mm and angled at 45 deg. This time it was able to get a reading when there was flow in the pipe. This confirms that the attenuation was too high previously. In a real application it is hoped that the lack of the PVC cover and the wider width of the water surface will provide enough more signal for a reading to still be achieved. It should be noted that a wide surface helps significantly with falloff as point objects falloff with 1/r^4 and planar objects 1/r^2.
In a rudimentary test, the height of the pipe was increased and the water velocity was also seen to increase. Now a more detailed experiment will be undertaken mostly to determine the linearity of this device.
For the experiment some changes had to be made to the PC host. This was to get some form of averaging on the output as this fluctuated frequently. The way this was done is by taking the past N = 20 FFT frames and averaging these. The FFT frames are the arrays of speed vs distance. From this the average distance and speed coordinate from measurements at least half of the maximum was found and printed to the terminal. This will serve as the measured data for the experiment.
A hosepipe was used to send water down the pipe. The height of the far end of the pipe was changed to get different angle measurements. water was injected at approximately the point directly below the sensor.
The results of the experiment are included below:
| Pipe Height Top (H)(mm) | ΔH (mm) | Velocity (v)(m/s) | Δv (m/s) |
|---|---|---|---|
| 0 | 20 | 0.17 | 0.03 |
| 100 | 20 | 0.66 | 0.02 |
| 200 | 20 | 0.79 | 0.02 |
| 300 | 20 | 0.89 | 0.02 |
| 410 | 20 | 0.96 | 0.02 |
| 610 | 20 | 1.13 | 0.02 |
To analyse these data we will apply Bernoulli's principal, thus we will assume our flow is steady and viscous forces are negligible.
We will assume water is injected at the top of the pipe with some initial velocity v, and that as the water runs down the pipe its velocity increases. At the point of measurement by the radar sensor its velocity is u.
As the pipe is inclined there is a height difference between the top of the pipe and the measurement point Δz. We assume that that any pressure gradients are negligible, hence
1/2 ρ u^2 = 1/2 ρ v^2 + ρg Δz
u^2 = v^2 + 2ρgΔz
Furthermore some geometry reveals that the height difference Δz is proportional to H, the height of the top of the pipe. Hence κH = Δz for some κ.
Finally this gives: u^2 = 2ρgκH + v^2.
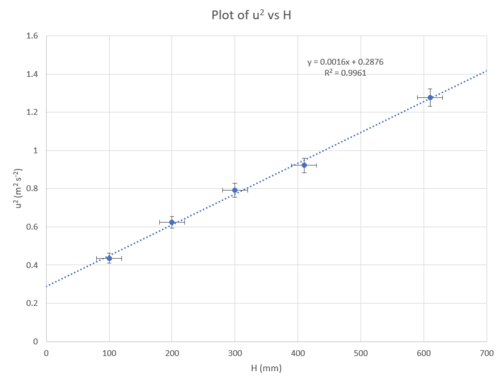
Thus a plot of u^2 vs H should provide a linear plot. It should be noted that the radar velocity sensor does not measure u, but infact u*cos(θ), where θ is the angle of the sensor from the water velocity in our case this is 45 deg, and constant, hence this conversion factor can be ignored.
Doing this we get the plot below. Note the zero height data-point was excluded from analysis. As I'm not as confident that the approximation made fit at this regime.
The plot indicates that the trend is fairly linear with an R^2 value of 0.996. The line of best fit also lies within the uncertainty of the data points. It indicates that the sensor does indeed make linear measurements of water velocity in the right conditions. What this experiment does not tell us is if absolute measurement is correct or of a linear calibration will need to be conducted. It does also not let us know what errors we should expect from the difference between water surface velocity and mean water velocity.
9th February 2021
In the work so far a radar lens was critical to the performance and focusing of the radar sensor. In any future design it will be necessary to have a lens present. 3D printing the lens is feasible as the mm waves are long relative to the minimum feature size of the 3d printer and geometric optics can be used as the waves are short relative to the size of the lenses. Measuring and characterizing materials at 60 GHz to make accurate calculations of the of the performance of lens is out of the scope of equipment at hand. Instead a empirical approach will be taken. A number of lenses will be designed and they will be tested at a set of different distances from the sensor. The one which performs optimally will be chosen for the design.
To do this both the lenses and a jig will need to be designed which is able to hold different lenses and different distances from the radar sensor. For this a simple block of wood with a grove cut out in it was made. Adding some blu-tack into the groove allows a bit of z-positioning for alignment of the optical axis. Lenses can be rested on the surface of the wood. Their size is such that when resting on the block they are approximately aligned with the optical axis.
In terms of the different lenses designed a variety designs were modded. The use of Fresnel lens was considered however it was found that diffractive effects would become prevalent if this was incorporated [1]. A Fresnel zone plate could also be considered however this is required to be made of metal, perhaps PCB printing will be an effective option for this however for the moment it won't be investigated.
The array of lens designs chosen were:
- A copy of the acnoneer Hyperbolic lens
- Hyperbolic lens scaled by 1.5
- 24 mm radius lens with surfaces on front and back (may be tricky to print)
- The 24 mm radius lens with front and back surfaces printed seperately
- 30 mm radius lens
- 30 mm radius lens (no holder to attach to back of previous)
- 30 mm radius lens with larger optical diameter
- 2 step Fresnel version of previous.


