Spectrophotometer
We have come up with a great idea to implement a low-cost spectroscopy sensor to measure various water quality parameters. The Sparkfun AS7265x spectroscopy sensor is introduced here (around AUD 60-100). It has three LEDS (VIS,UV,IR) which can measure the intensity for the wavelength ranging from 410nm to 940 nm. We would like to investigate any potential application with this sensor...
Contents
10/01/2023
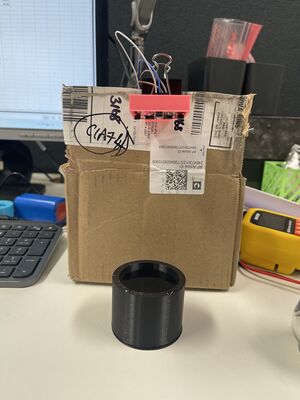
Firstly, we hava come out an initial design for holding the sensor, and we use the clip to mount it to a vertical surface to do some preliminary tests.A black cup is 3D printed to store the water for measurement purpose.
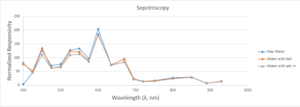
It is good to know what roughly the spectroscopy for the water would be under low turbidty level. It can be seen that the sensor didn't receive much reflection for frequency between 710nm and 940nm.
25/01/2023
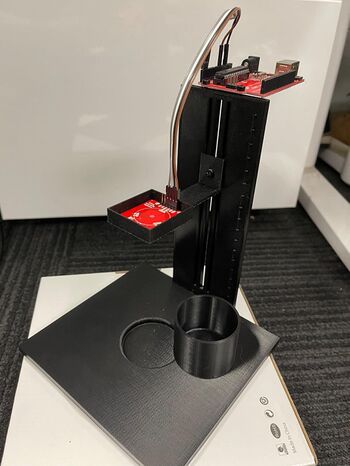
After the first design, we have come out some updated version for the stand that can hold the sensor instead of mounting to a cardbox. Now both the sensor and cup can be located in fixed position.And we have changed the colour of both cup and stand to be black to minimize the potential background noise.
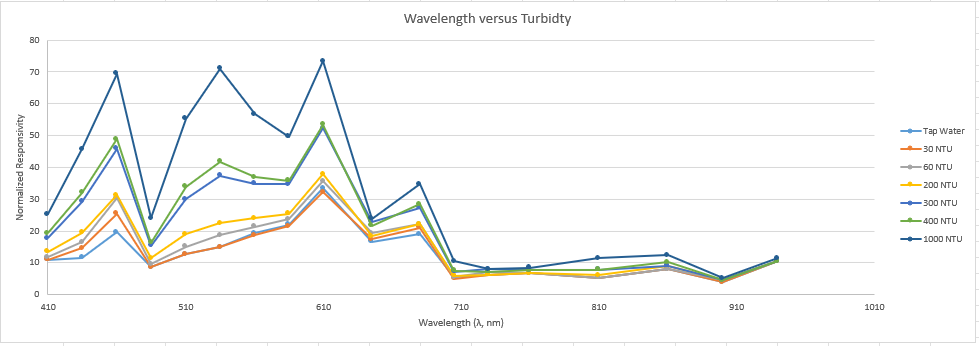
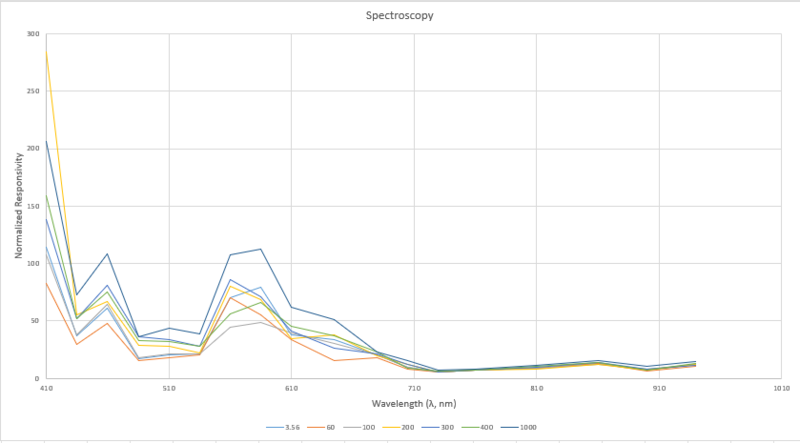
This time we have using some different turbidty solution to measure the spectroscopy at each turbidty level.It can be seen that some correlation might exist at certain frequency (such as 610nm).
01/02/2023
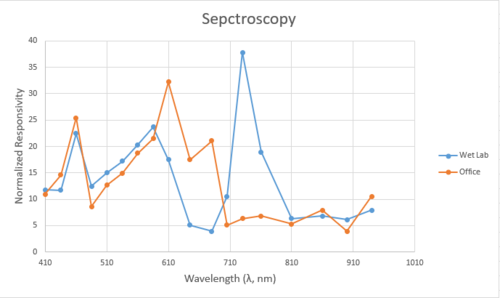
Today,we bring all the equipment to the wet lab and would like to test again with same turbidty solution, while we have found something interesting:
It can be seen that large variation existed for the same measurement sample. We start thinking this might because of the light problem as the light in two rooms are different. And for now we just take one measurement reading with all LEDS on the sensors once to obtain the data. With strong light, the sensor might not be able to receive the correct reflection from the surface. So we need to get some improvements for our code to count for the background noise effect.
01/02/2023
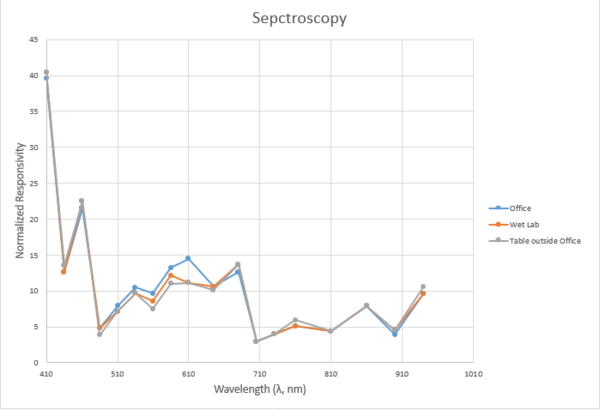
We have modified our code to include a initial scan without using LEDs, this spectroscopy reading is later used as background reference.For now, we try to use the spectroscopy that got with all LEDs minus the spectroscopy that got without LEDs to get our final spectroscopy. We have selected three test locations:
1) Office (Normal Light Condition) 2) Wet lab (Strong Light Condition) 3)Table outside the office (Slight Light Condition)
The results looks pretty good as the spectroscopy obtained at different locations are very close to each other, the background noise has been reduced.
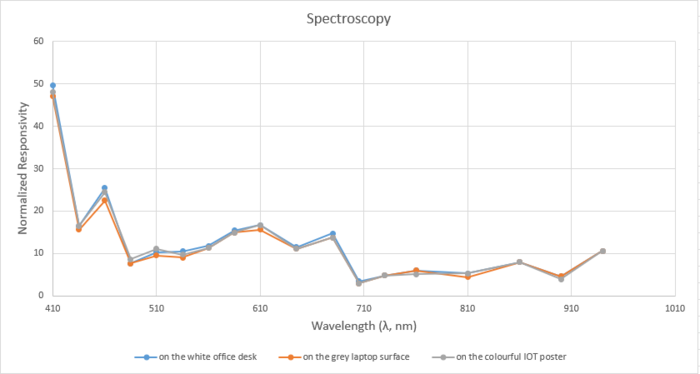
Later, we have also let the sensor stands on different surface to see whether this will affect the spectroscopy of the detected object. The surface we selected are:
1) Office Desk (White Surface) 2) Laptop (Grey Surface) 3) IOT Poster (Colourful Surface)
The spectroscopy obtained from three different back surfaces aligned well with each other. Now we would like to continue testing the water with different turbidty level again.
16/02/2023
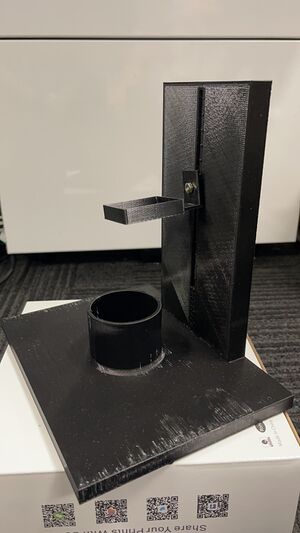
Today we have found that the sensor case we designed originally is not aligned in the middle of the black cup. We have modified our design for both the sensor case and stand:
This stand have two trenches that we can adjust the sensor height in the future while maintain its stay in horizontal surface. And the arduino board has been locked on the top of the stand. A pre-cut circle surface is designed at the bottom of the stand that can fit the size of the cup,so that we can easily get the black cup out and in, making the filling progress more easier:
With this new design, we have tested it with all the turbidty solution again:
09/03/2023
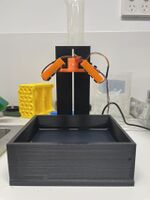
We have modified the container up to a black square box to maximize its capacity for carrying water.
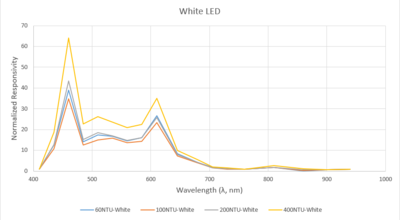
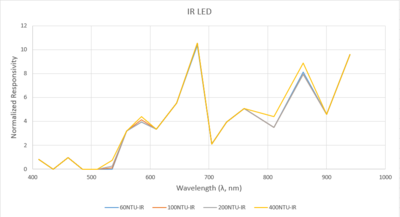
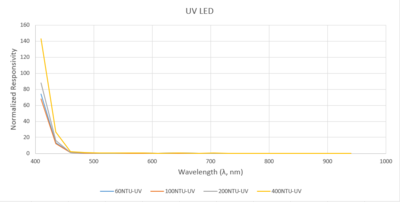
Also, we have updated the sensor reading function, now the sensor can read the spectroscopy information from White, IR, UV and All LEDs together separately. This could help us better understand how different objects behaves to different LEDs).
For the experiment settings, we have added cardboard as the cover when we do the experiment to eliminate the effect of other light resources.
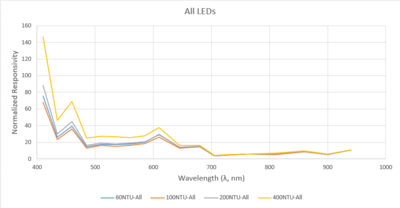
Four different turbidity solutions (60NTU, 100NTU, 200NTU, 400NTU) has been tested after five minutes settle time.The results (average of 6 times reading) are shown as follows:
16/03/2023
We have extended our reference turbidity sets to a larger level:
| Turbidity | Values |
|---|---|
| Low Turbidity Level | 0,0.61,0.68,1.23 |
| Mid Turbidity Level | 25,50,55.5,75,108 |
| High Turbidity Level | 199,300,393 |
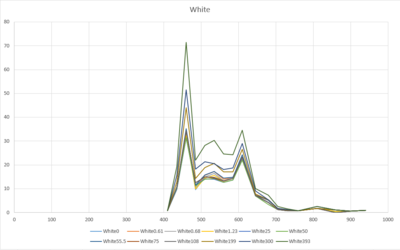
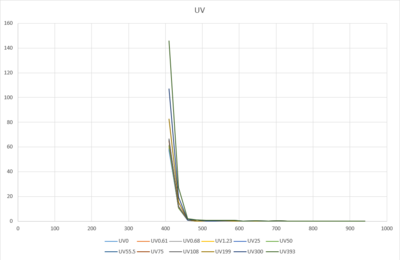
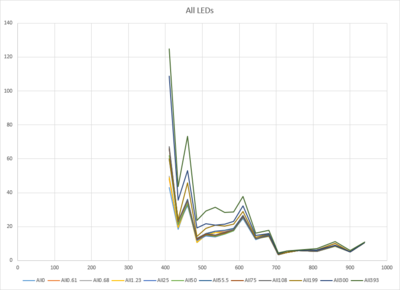
We have then followed the same experiment procedure and have obtained the spectroscopy for the above 12 turbidity levels. After got the spectroscopy, we have started to look at if there is any correlation existed between turbidity level and normalized signal value.
White Light:
UV Light:
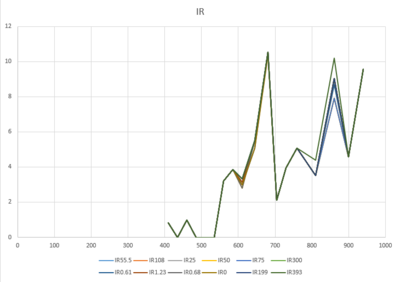
IR Light:
All LEDs:
For the IR, we didn't get any good correlation curve so it has been eliminated from the model.
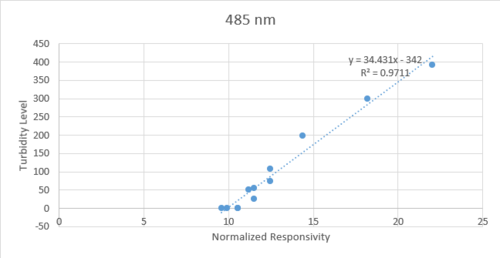
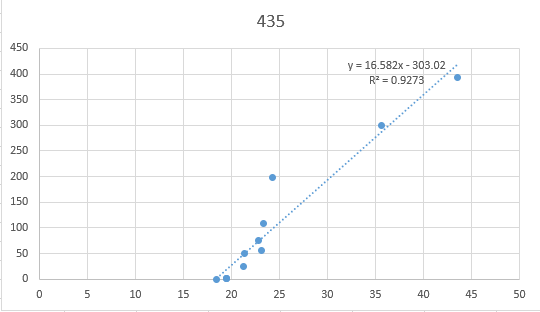
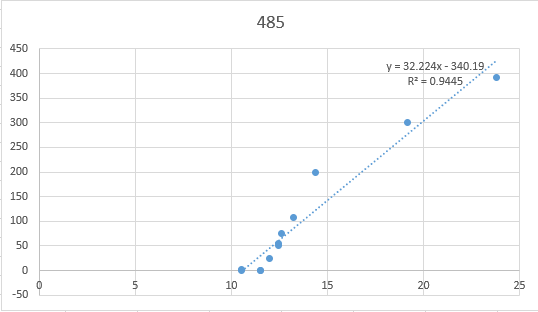
After establish a few relationship curve ( overall above 90% for turbidity ranging from 0 to 300 NTU), We have started to establish a initial prediction model to see if we can predict the turbidity level:
| LEDs | Wavelength | Regression Curve |
|---|---|---|
| White | 485 nm | y= 34.431x-342 |
| UV | 410 nm | y= 4.7096x-249.06 |
| UV | 435 nm | y= 24.651x-231.34 |
| All | 435 nm | y= 16.582x-303.02 |
| All | 485 nm | y= 32.224x-340.19 |
Later we have brought three water samples from Troups Creek Retention pond to see if we can actually predict the turbidity level, the output value are compared with the reference value that obtained from the Thermo Scientific Turbidity Sensor (ORION A14500), the results are shown as follows:
From the result here, it can be seen that the best predict regression curve is using white LED at 485nm, with uncertainty generally under 30%.
For some instance, the model could able to predict good turbidity level (the one marked as green), but it didn't occurred constantly under same LED condition.
It is suggest further dataset might be needed to be fit into the predict model, and it needs to come up with a way that can reduce the uncertainty caused by the sensor.
23/03/2023
In this week, we would like to test the impact of light (with or without cover box) and the impact of different height (the distance from the water surface)
Impact of Light
Experiment Setup
The experiment is conducted with and without cover box after 5-mins setting up time.
6 different turbidity solutions were used:
| Turbidity | Values |
|---|---|
| Low Turbidity Level | 0 |
| Mid Turbidity Level | 50,75,100 |
| High Turbidity Level | 199,300 |
Result
The results shown here are calculated based on the difference between without case value with with case value.
The grey block shows the 5 reference points we selected previously.
The yellow blocks shows some new value which comes out when we did not use the cover.
Conclusion
Overall, when look at the 5 reference points, the difference is not significant ( error rate < 20%). This result is not so bad as the sensor itself has around +/-12% accuracy (https://www.sparkfun.com/products/15050).
Except for those extreme error points(100% error rate), overall, the error is under 35% when turbidity under 100 NTU and under 50% when turbidity ranging from 100 to 300 NTU.
Impact of Height
Experiment Setup
The height defined here is referring to the height from the water surface to the edge of the sensor case. The height for previous experiment is 95mm.
The experiment is conducted with cover box after 5-mins setting up time.
We have conducted another two height at 35mm and 135mm (the minimum and maxmimum value we could reach for current stand). 6 different turbidity solutions were used:
| Turbidity | Values |
|---|---|
| Low Turbidity Level | 0 |
| Mid Turbidity Level | 50,75,100 |
| High Turbidity Level | 199,300 |
Result
5 Reference Points:
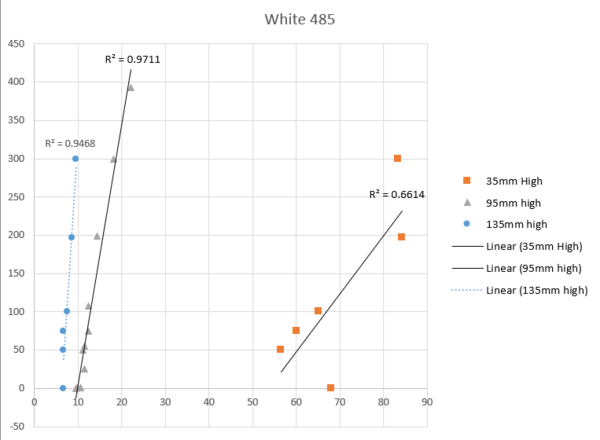
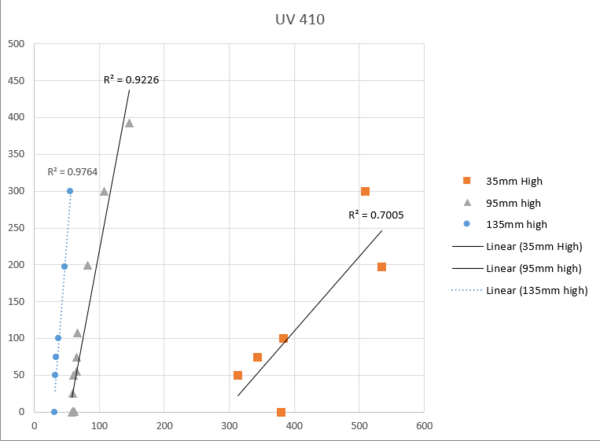
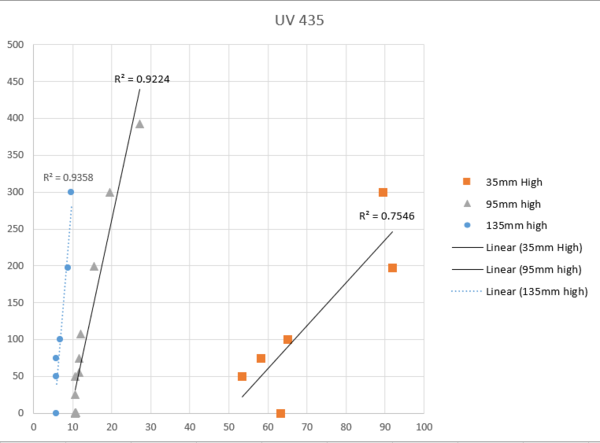
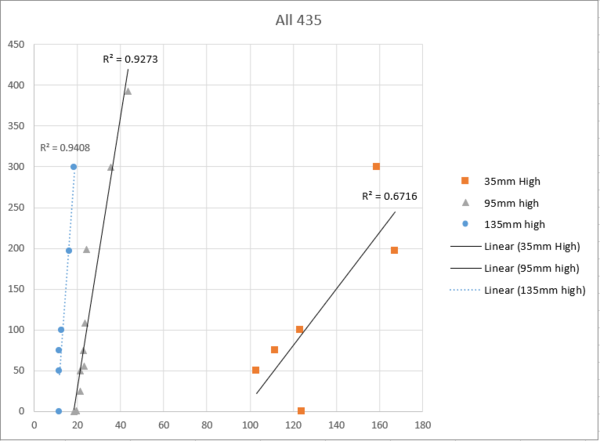
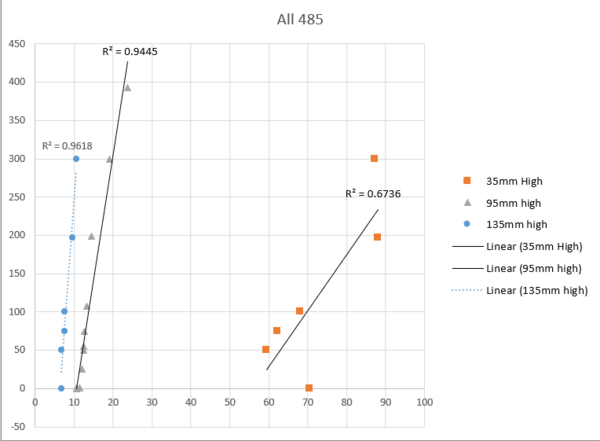
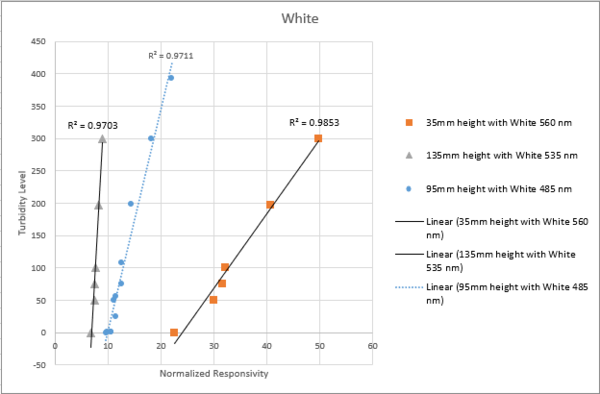
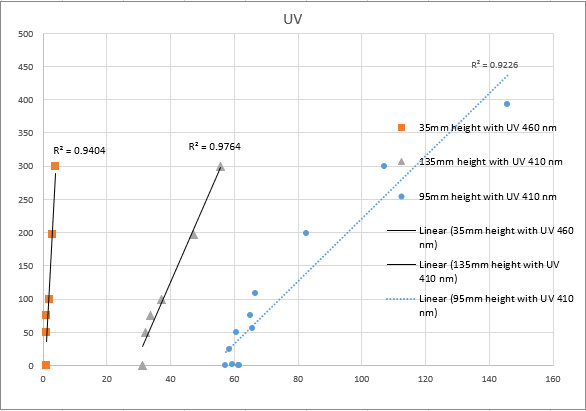
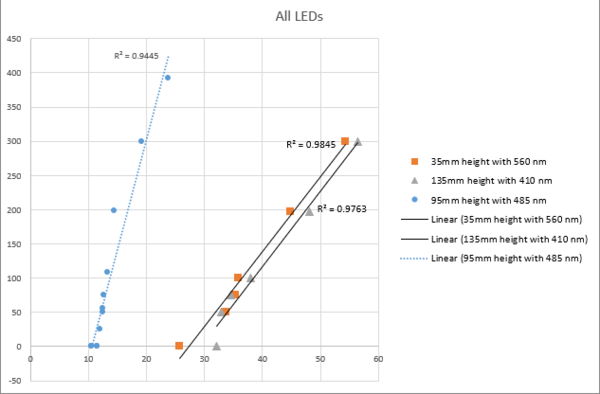
LEDs:
Conclusion
When look at the 5 reference points, it can be seen clearly that better correlation relationship can be achieved when the height increased.
When look at each LED individually, better correlation could be achieved at lower wavelength if the height is increased.
Generally, the best relationship is still achieved at higher height (correlation above 97% for White, UV and All LEDs with height of 135mm).
30/03/2023
In this week, we would like to continue test the impact of light (with or without cover box) and the impact of different height (the distance from the water surface)
Impact of Light
Experiment Setup
The experiment is conducted with and without cover box after 5-mins setting up time for same turbidity solution.
6 different turbidity solutions were used:
| Turbidity | Values |
|---|---|
| Low Turbidity Level | 0 |
| Mid Turbidity Level | 50,75,100 |
| High Turbidity Level | 199,300 |
Result
The results shown here are box plot for White, UV and all LED conditions.
Conclusion
Overall, the variation between with and without cover is not very significant.
Generally, when look at all LEDs and White LED, with-cover readings tend to be larger than the without-cover readings. For the UV LED only, the difference is not significant.
Impact of Height
Experiment Setup
The height defined here is referring to the height from the water surface to the edge of the sensor case.
As we would like to explore the how high the sensor could be able to provide valuable data, a 1000 mm long bar was used, thus no cover was used in this experiment.
The experiment is conducted after 5-mins setting up time for each turbidity solution.
We have conducted in total five different heights ranging from 25mm (Just above the water surface and 725mm:
| Height | 25,225,425,625,725 (mm) |
|---|
3 different turbidity solutions were used:
| Turbidity | Values |
|---|---|
| Low Turbidity Level | 0 |
| Mid Turbidity Level | 100 |
| High Turbidity Level | 300 |
Result
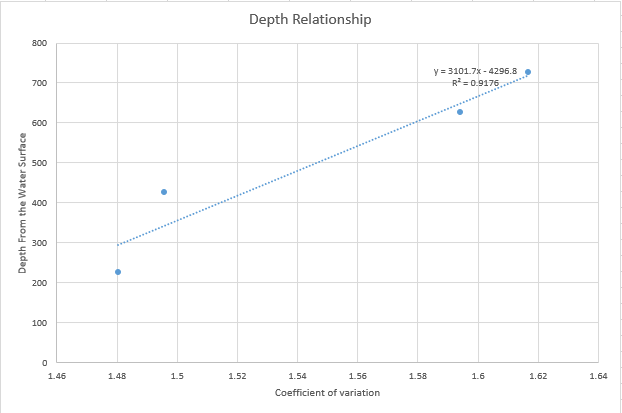
The results here were analyzed using coefficient of variation for each turbidity and individual LED condition. Then the average coefficient of variation value were taken by average all the readings at certain depth.
The results are shown here:
| Coefficient of Variation | Values |
|---|---|
| 25mm | 1.86 |
| 225mm | 1.48 |
| 425mm | 1.49 |
| 625mm | 1.59 |
| 725mm | 1.61 |
It can be seen that when the sensor is very close to the water surface, the variation is very huge, thus hard to find the potential depth relationship, by remove the 25mm value for now, and use the rest value to plot a regression curve, the depth relationship can be found as:
Conclusion
This result could illustrate the potential of using spectrometer sensor as a depth sensor. More height experiments are needed to further approve this concept.
07/05/2023
During the past period, we were aiming to investigate the potential of using two spectrometer sensors to see whether it can increase the accuracy of our data. The Sparkfun Qwwic Mux port is used to connect two Sparkfun AS7265X spectrometer sensors.
Experiment Setup
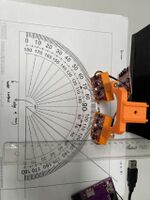
The experiment is conducted without cover box at 95mm height after 5-mins setting up time for same turbidity solution. The set up configuration is shown as below:
For the first trial, the angle between two spectrometer sensors is set as 90 degree.
5 different turbidity solutions were used:
| Turbidity | Values |
|---|---|
| Low Turbidity Level | 0 |
| Mid Turbidity Level | 50,75,100 |
| High Turbidity Level | 199 |
Result
The spectroscopy graph of White LED is shown as follow and the best correlation relationship between turbidity level and normalized sensor reading can be found at 460nm wavelength.
The spectroscopy graph of UV LED is shown as follow and the best correlation relationship between turbidity level and normalized sensor reading can be found at 410nm wavelength.
The spectroscopy graph of All LEDs is shown as follow and the best correlation relationship between turbidity level and normalized sensor reading can be found at 860nm wavelength.
Conclusion
From the result, it can be shown that the dual Spectrosensor can get the better correlation relationship up to 97% for UV / White and All LEDs condition.
For the next experiment, we will adjust the angles between two sensors to let it have good reflectance over the water surface.
18/05/2023
Following the last experiment, we would like to continue investigate more parameters which may affect the spectrophotometer. In this experiment, we have adjusted the angle between two sensors and would like to let the receiver sensor can receive the light that sender sensor emitted reflected back from water surface.
Experiment Setup
The experiment is conducted without cover box at 90mm height after 5-mins setting up time for same turbidity solution. The set up configuration is shown as below:
For the first trial, the angle between two spectrometer sensors is set as 90 degree.
5 different turbidity solutions were used:
| Turbidity | Values |
|---|---|
| Low Turbidity Level | 0 |
| Mid Turbidity Level | 50,75,100 |
| High Turbidity Level | 199 |
Result
The spectroscopy graph of White LED is shown as follow and the best correlation relationship between turbidity level and normalized sensor reading can be found at 460nm wavelength.
The spectroscopy graph of UV LED is shown as follow and the best correlation relationship between turbidity level and normalized sensor reading can be found at 410nm wavelength.
The spectroscopy graph of All LEDs is shown as follow and the best correlation relationship between turbidity level and normalized sensor reading can be found at 860nm wavelength.
Conclusion
From the result, it can be shown that the dual Spectrosensor can get the better correlation relationship up to 97% for UV / White and All LEDs condition.
For the next experiment, we will adjust the angles between two sensors to let it have good reflectance over the water surface.
