AmmoniaSensor
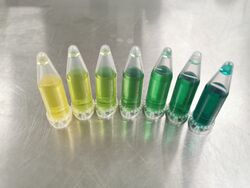
We plan to make a simple ammonia sensor that make use of ammonia test kit. This test kit works by taking 5ml of water that you want to test and then mixed with the coloring agent that are given by the test kit. After mixing the water will develop a color which corresponds to the level of ammonia that the water had. Testing code (for use on arduino Uno) : File:Tcs34725 testing.ino note: if this code is going to be used to run on the bosl board, just recalculate the value on the analogwrite that are used to power the LED to achieve 2.7v
Contents
18 August 2022
We found a color sensor that had a potential for being used in this projects. TCS34725 sensor works by detecting red, green and blue color spectrum and intensity into signal. Based on the early testing that we got from this sensor, it was able to perceive the color difference on an object but the accuracy of the colors are dependent on how much the reflection of color could come to the sensors.
Testing Result
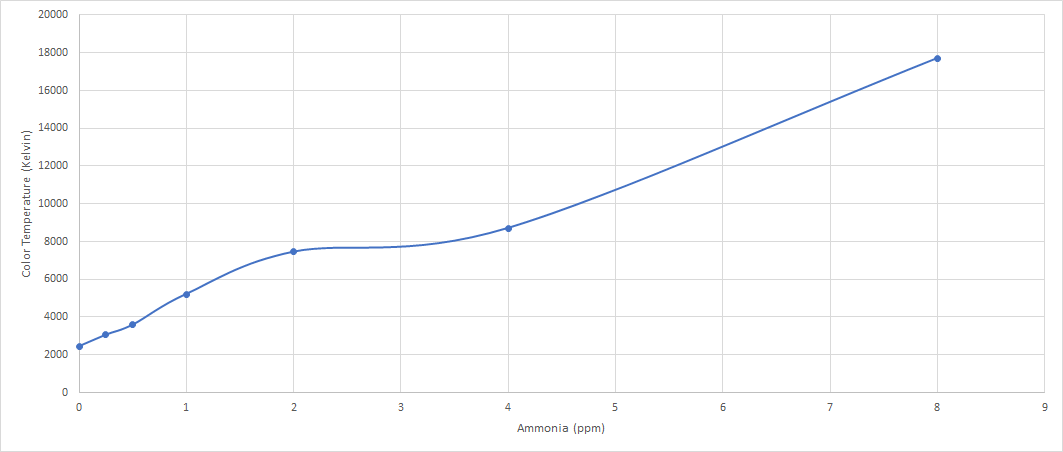
Using the current sensor we are going to test it directly with a sample water containing ammonia in various level from 0-8 ppm that are set to follow the color level chart from the test kit. The water is put in a clear 5ml container so we could shine light through the container to get the proper color reading.
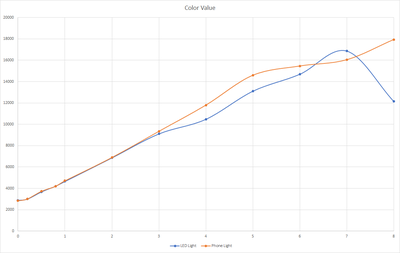
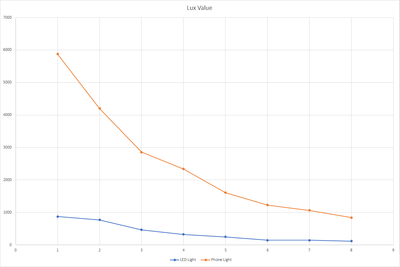
From the experiment, we found that we could get a better reading if we used external light source than using the build in one as the source of light is too close towards the sensor which could affect the reading. We used the flashlight of our phone as our source of light and put the 5ml container above the light and have it glow through it from the bottom of the container.
From the testing result we got the following value as seen in the graph below.
10 October 2022
Testing for ammonia at different level concentration of Ammonia from 1- 8 ppm. Redoing the test since there is a possibility of a wrong concentration that are used in the previous test.
| PPM | Colour Temp | SD |
|---|---|---|
| 1 | 4525 | 4.01 |
| 2 | 5624 | 15.83 |
| 3 | 7514 | 87.40 |
| 4 | 9902 | 146.18 |
| 5 | 11607 | 65.38 |
| 6 | 12787 | 485.55 |
| 7 | 16072 | 131.30 |
| 8 | 17669 | 456.84 |
11 October 2022
Testing the ammonia level below from 0 – 1 ppm at various level of concentration
| PPM | Colour Temp | SD |
|---|---|---|
| 0 | 2588 | 3.39 |
| 0.2 | 2969 | 19.90 |
| 0.4 | 3217 | 27.75 |
| 0.5 | 3491 | 6.03 |
| 0.6 | 3601 | 13.42 |
| 0.8 | 3883 | 9.88 |
| 1.0 | 4573 | 54.60 |
All test that we have done so far are done with DI water. Next step we will try using water with some turbidity and see if there's a significant difference on the result.
25 October 2022
Make a new prototype case for the ammonia sensor For now the case still use a phone as a light source. The next iteration will integrade the case with an LED light source.
22 November 2022
Done testing the sensor with lake water as our new base for dilution. With this new test we also tried a new LED light that we got that could operate from 2.7V - 3V. During the testing we will also want to know if this new light source have a significant impact to the reading. For the first test we set the LED at 2.7V and the result are shown below.
| PPM | LED Light | Phone Light |
|---|---|---|
| -1* | 6022.05 | 5960.86 |
| 0 | 2886.62 | 2843.14 |
| 0.2 | 2998 | 3026.10 |
| 0.5 | 3672.67 | 3737.43 |
| 0.8 | 4209.57 | 4206.05 |
| 1 | 4648.29 | 4714.81 |
| 2 | 6856.10 | 6897.10 |
| 3 | 9102.57 | 939347.24 |
| 4 | 10470.10 | 11794.30 |
| 5 | 13100.2 | 14585 |
| 6 | 14688.6 | 15453.7 |
| 7 | 16866.1 | 16039.2 |
| 8 | 12158.1 | 17927.5 |
Based on the results, the new LED light gave almost the same result from 0 - 4 ppm compared when we used the original phone for the light source. Above that level, the sensor gave a lower reading and goes weird at 7-8 ppm. This might be affected by the amount of lights that are captured by the sensor as the higher ppm solution have a darker color and it absorbs most of the light that are coming out from the led light, reducing the sensor ability to read the correct value.
5 December 2022
Turbidity test on ammonia solution Test are done on by making a 0.4 ppm solution on a 50ml container by dilution. The dilution are done by DI water that are mixed with various value of mud to replicate the effect of turbidity on various level.
One thing that we done wrong on this level is having the turbid water mixed outside of the 50 ml bottle hence, we haven't actually validate if the concentration of the ammonia is the same on all container.
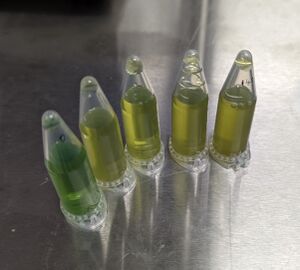
But preliminary result from the testing shows that turbidity does affect the reading as the color of the liquid goes more towards yellow with the increase in turbidity.
| Ammonia Test | ||||
|---|---|---|---|---|
| NTU | MIN | AVG | MAX | STD DEV |
| 0 | 4672 | 4688.33 | 4708 | 10.85 |
| 17.2 | 3570 | 3581.29 | 3593 | 7.22 |
| 33.6 | 3485 | 3491.24 | 3498 | 3.46 |
| 111 | 3229 | 3239.67 | 3252 | 6.89 |
| 140 | 3061 | 3074.71 | 3086 | 8.10 |
9 December 2022
The main point of the testing is to capture the relationship between turbidity and ammonia concentration in the reading. Since turbidity may have a variance in between subsample that are taken. To ensure the same level of turbidity the test are done by first ensuring the subsample of the turbidity liquid are in the acceptable range. steps taken are as follow :
- Shake the main sample turbidity bottle
- take half of the turbidity liquid into the sampling bottle (7ml/15ml)
- Re-shake the main sample turbidity bottle
- fill the other half into the sampling bottle
- shake the sampling bottle and do a turbidity measurement on the subsample.
- repeat step 1- 5 until we have 5 sub sample
- Start dosing ammonia into the subsample.
Results are as follow:
| PPM | NTU | 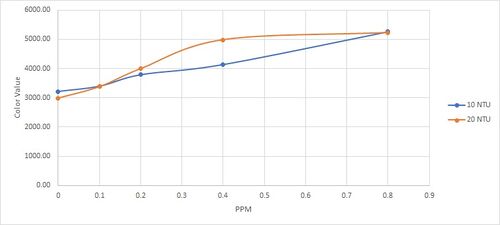
| |||||||||
|---|---|---|---|---|---|---|---|---|---|---|---|
| 10 | 20 | ||||||||||
| 7.71 | 7.78 | 7.94 | 8.27 | 9.45 | 22.2 | 23.3 | 24.6 | 25.3 | 25.7 | ||
| -1 | 6920.86 | 6617.29 | |||||||||
| 0 | 3218.76 | 2992.29 | |||||||||
| 0.1 | 3399.00 | 3382.48 | |||||||||
| 0.2 | 3792.38 | 3996.86 | |||||||||
| 0.4 | 4140.86 | 4984.48 | |||||||||
| 0.8 | 5264.67 | 4984.48 | |||||||||
11 January 2023
We redid the test step that are done on 9 Dec and tried with more different levels of NTU, the results are as shown below.
| NTU Group | 0 | 10 | 20 | 35 | 80 | 160 | 250 | |||||||
|---|---|---|---|---|---|---|---|---|---|---|---|---|---|---|
| PPM | Actual NTU | Avg Color Value | Actual NTU | Avg Color Value | Actual NTU | Avg Color Value | Actual NTU | Avg Color Value | Actual NTU | Avg Color Value | Actual NTU | Avg Color Value | Actual NTU | Avg Color Value |
| -1 | 0 | 7064.05 | 12.5 | 6732.57 | 21.1 | 6479.90 | 35.4 | 6346.33 | 78.2 | 5714.90 | 156 | 5221.43 | 244 | 4286.00 |
| 0 | 0 | 3239.19 | 12.5 | 3317.52 | 21.1 | 3183.71 | 35.4 | 3095.48 | 78.2 | 2856.29 | 156 | 2857.14 | 244 | 2696.10 |
| 0.1 | 0 | 3472.62 | 14.1 | 3460.62 | 22.8 | 3389.52 | 34.9 | 3345.19 | 81 | 3186.19 | 162 | 3027.24 | 252 | 2880.62 |
| 0.2 | 0 | 3475.90 | 11.1 | 3524.19 | 20.6 | 3451.95 | 35.3 | 3403.14 | 84.9 | 3293.00 | 165 | 3130.38 | 250 | 2927.29 |
| 0.4 | 0 | 3923.95 | 13.7 | 3741.95 | 21 | 3890.14 | 35.3 | 3866.14 | 82.4 | 3548.33 | 164 | 3362.43 | 259 | 3222.14 |
| 0.8 | 0 | 4628.43 | 12.8 | 4570.95 | 21.4 | 4891.90 | 32.3 | 4698.67 | 84.6 | 4481.57 | 169 | 4249.48 | 261 | 3839.71 |
| 1 | 0 | 4788.00 | 11.7 | 4870.19 | 21.7 | 4953.29 | 34.5 | 4793.33 | 83.2 | 4663.00 | 167 | 4277.71 | 259 | 4012.57 |
| Main Graph | Color Value from 0 - 1 PPM |
|---|---|
 |

|
Qualitative analysis: - The higher the NTU the lower the color value reading will be - Trend wise they all seems to have an upward slope although from 0 - 35 NTU the size of the slope seems a bit random. - Compared to previous reading, the 0 NTU seems to have a higher reading which might suggest there could be contamination affecting our testing or the new test kit that we used may have different concentration than the one we previously used ( although unlikely to happen).
Regression
| NTU | Regression |
|---|---|
| 0 | y = 1607.5x + 3251.6 |
| 10 | y = 1594.7x + 3249.8 |
| 20 | y = 1920x + 3160.1 |
| 35 | y = 1789.4x + 3121.4 |
| 80 | y = 1814x + 2915.6 |
| 160 | y = 1535.1x + 2844.4 |
| 250 | y = 1347.3x + 2701.7 |
If we tried to extract the linear regression from each line, the each level will gave us the regression as shown in the table above. Overall the intercept shows a gradual decrease with an increase in NTU. The slope on the other hand are quite random having value range from 1347.3 - 1814.
30 January 2023
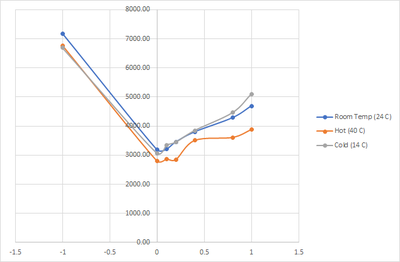
Testing for the effect of temperature to the reading of ammonia color. We do all of the test with DI water in different temperature. To make it hotter we use a lab induction stove to heat the water before we put the water in the 5ml tube. For the colder temp, we just put it in the fridge while monitoring the temp. After that we dose the different ammonia level into each testing tube. The temperature are being measured using a infrared thermometer.
Data that we got as follow:
| Temperature | PPM | Color Temp | Water Temp |
|---|---|---|---|
| Hot (40 C) | -1 | 6765.380952 | 54.1 |
| 0 | 2805.047619 | 40 | |
| 0.1 | 2870.380952 | 39.9 | |
| 0.2 | 2849.714286 | 40.1 | |
| 0.4 | 3509.190476 | 40.1 | |
| 0.8 | 3611.095238 | 39.6 | |
| 1 | 3879.380952 | 39.8 | |
| Room Temp (24 C) | -1 | 7172.857143 | 23.7 |
| 0 | 3187.857143 | 24.8 | |
| 0.1 | 3201.619048 | 24.6 | |
| 0.2 | 3452.142857 | 24.3 | |
| 0.4 | 3800.047619 | 24.2 | |
| 0.8 | 4285 | 24.5 | |
| 1 | 4689.714286 | 24.4 | |
| Cold (14 C) | -1 | 6687.095238 | 12.1 |
| 0 | 3064.142857 | 14 | |
| 0.1 | 3343.095238 | 13.5 | |
| 0.2 | 3448.47619 | 13.2 | |
| 0.4 | 3848.904762 | 14 | |
| 0.8 | 4463.761905 | 14 | |
| 1 | 5105.333333 | 14 |
| Main Graph | Color Value from 0 - 1 PPM |
|---|---|
 |

|
From the data we saw that higher temperature could affect the reading as it could reduce the value by 400 kelvin lower compared to the room temperature readout. As such, getting sample in an area with a hotter might affect the readout more.
3 February 2023
We do the same testing as before, but with different temperature. The results are as follow:
| Category | PPM | Color Temp | Water Temp |
|---|---|---|---|
| Hot (28 C) | -1 | 6835.52 | 28.1 |
| 0 | 3008.76 | 26.6 | |
| 0.1 | 3122.52 | 27.4 | |
| 0.2 | 3219.57 | 27.5 | |
| 0.4 | 3515.76 | 27.4 | |
| 0.8 | 3946.62 | 27 | |
| 1 | 4321.86 | 27.3 | |
| Room Temp (22 C) | -1 | 6866.48 | 21.5 |
| 0 | 3125.19 | 22.1 | |
| 0.1 | 3390.00 | 22.1 | |
| 0.2 | 3485.19 | 22.1 | |
| 0.4 | 3855.67 | 21.9 | |
| 0.8 | 4422.05 | 21.9 | |
| 1 | 4999.33 | 21.9 | |
| Cold (18 C) | -1 | 6659.62 | 15.9 |
| 0 | 3124.33 | 19.4 | |
| 0.1 | 3310.38 | 18.6 | |
| 0.2 | 3403.43 | 18.6 | |
| 0.4 | 3869.67 | 18.6 | |
| 0.8 | 4465.19 | 18.4 | |
| 1 | 4865.62 | 18.6 |
| Main Graph | 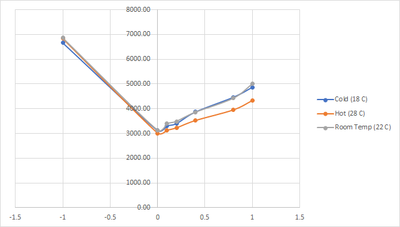 |
Color Value from 0 - 1 PPM | 
|
| Main Graph Combined | 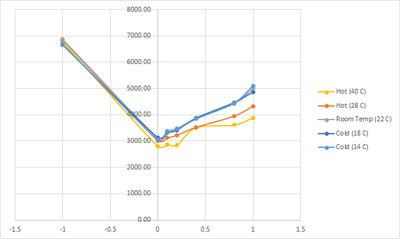 |
Color Value from 0 - 1 PPM Combined | 
|
With this test we tried to lower the difference in the changes of temperature of the water and see if the change that we got on the previous test are only happened due to high temp difference, but apparently even a hotter water at 28 degrees already have the same effect albeit lower than when it was heated up to 40 degrees
13 February 2023
We retested the ammonia samples of different turbidities ranging from 0 NTU to 200 NTU with the low-cost ammonia sensor. 10 random samples were selected to be analysed for the ammonia concentration in the lab. The table below shows the measured and chemically analysed ammonia concentration of the 10 selected samples.
| Sample ID | Concentration (mgL) | NTU | Date collected | NH3 analysed (mg/L N) |
|---|---|---|---|---|
| 1 | 0.1 | 0 | 13/2/2023 | 1.0 |
| 2 | 0.1 | 20 | 13/2/2023 | 0.092 |
| 3 | 0.1 | 200 | 13/2/2023 | 0.092 |
| 4 | 0.4 | 0 | 13/2/2023 | 0.36 |
| 5 | 0.4 | 40 | 13/2/2023 | 0.37 |
| 6 | 0.8 | 120 | 14/2/2023 | 0.71 |
| 7 | 2.0 | 20 | 13/2/2023 | 1.8 |
| 8 | 2.0 | 120 | 14/2/2023 | 1.7 |
| 9 | 2.0 | 200 | 14/2/2023 | 1.7 |
| 10 | 5.0 | 90 | 14/2/2023 | 4.7 |
| Detection Limit | 0.001 | |||
| Date of analysis | 16/2/2023 | |||
22 February 2023
10 dry stormwater samples were collected at three different sites (Cardinia - 3 samples, Dandenong Creek - 3 samples and Troups Creek - 4 samples). The turbidities for each samples were measured and then tested with the ammonia sensor without adding any ammonia solution. From the colour values obtained, the level of ammonia can be estimated from the calibration curve. All the stormwater samples were frozen and sent for testing on 1st March 2023. The results for both methods are tabulated below.
| Site | Turbidity (NTU) | Colour value | Estimated ammonia (mg/L) | NH3 analysed (mg/L N) | |
|---|---|---|---|---|---|
| Without reagent | With reagent | ||||
| DC 1 | 14.3 | 6375 | 3145 | 0.01 | 0.03 |
| DC 2 | 17 | 6668 | 3181 | 0.025 | 0.017 |
| DC 3 | 15.3 | 6673 | 3244 | 0.05 | 0.005 |
| Cardinia 1 | 20 | 6127 | 3086 | 0.025 | 0.006 |
| Cardinia 2 | 18.7 | 6244 | 3076 | 0.025 | 0.005 |
| Cardinia 3 | 19.1 | 6543 | 3019 | 0.025 | 0.013 |
| TC inlet | 4.53 | 6666 | 3241 | 0.025 | 0.005 |
| TC mid | 76.1 | 5787 | 3037 | 0.075 | 0.048 |
| TC outlet | 44.4 | 6085 | 3030 | 0.025 | 0.001 |
| TC sedimentation | 54 | 6132 | 2968 | 0.025 | 0.001 |
16 March 2023
Another lab experiment conducted with storm water collected from LangLang River, however this time it is spiked with waste water collected from Pankenham. The experiment was conducted in the following manner :
- Three 100ml of storm water standard solutions were prepared, 0%, 0.5% and 5% waste water concentration respectively.
- Turbidity readings were taken 3 times right after the standard solutions are prepared
- Each standard solution were separated into 2 50ml falcon tube, 1 for our ammonia sensor testing, another for ammonia concentration evaluation
- Each standard solution were tested 3 times using our ammonia testing kit, 3 minute resting time was given to each testing vials for the chemicals to fully react
The following table shows the result of this experiment:
| Sample ID | Percentage of Waste Water | Turbidity(NTU) | Temperature | Colour Temperature | Estimated Ammonia Concentration(mg/L) | Actual Ammonia Concentratoin (mg/L) |
|---|---|---|---|---|---|---|
| LL 0% | 0% | 17.2 | 19.6 | 2868 | 0 | 0.011 |
| 2948 | ||||||
| 2838 | ||||||
| LL 0% (-1) | 5506 | |||||
| LL 0.5% | 0.5% | 18.6 | 19.6 | 4117 | 0.475 | 0.67 |
| 4036 | 0.45 | |||||
| 4000 | 0.44 | |||||
| LL 0.5% (-1) | 5492 | |||||
| LL 5% | 5% | 24 | 19.6 | 6777 | >1 | 5.2 |
| 7021 | ||||||
| 6775 | ||||||
| 6905 | ||||||
| 6969 | ||||||
| 6968 | ||||||
| LL 0.5% (-1) | 5228 |
(-1) represent no colour reagent was added into the solution, representing the raw solution colour. And 5% waste water solution was repeated 6 times because the colour temperature disparity between the first 3 readings are >2000.
Currently, the ammonia concentration that is above 1mg/L N will overshoot the existing calibration curve that we use for estimating ammonia concentration.
22 March 2023
Based on the 16th March results, 5 different ammonia concentration is made this time, with the currently calculated ammonia concentration in our waste water, standard solutions of 0.1mg/L, 0.2mg/L, 0.4mg/L, 0.8 mg/L and 1.2 mg/L ammonia concentration are made.
Using previous lab result, the concentration of ammonia in the waste water is estimated to be 104 - 134 mg/L.
The same experiment as 16th March has been performed, as per its procedure.
Here are the following result:
| Sample ID | Turbidity(NTU) | Colour Temperature | Estimated Ammonia Concentration(mg/L) |
|---|---|---|---|
| LL 0.1 | 18.43 | 3112 | 0.025 |
| 3123 | 0.025 | ||
| 3267 | 0.06 | ||
| LL 0.1(-1) | 6242 | ||
| LL 0.2 | 17.33 | 3094 | 0 |
| 3245 | 0.05 | ||
| 3241 | 0.05 | ||
| LL 0.2(-1) | 6102 | ||
| LL 0.4 | 19.13 | 3489 | 0.225 |
| 3731 | 0.325 | ||
| 3371 | 0.075 | ||
| LL 0.4(-1) | 6102 | ||
| LL 0.8 | 18.46 | 3978 | 0.45 |
| 3746 | 0.325 | ||
| 3734 | 0.325 | ||
| LL 0.8(-1) | 5935 | ||
| LL 1.2 | 20.63 | 4219 | 0.525 |
| 4173 | 0.425 | ||
| 4380 | 0.59 | ||
| LL 1.2(-1) | 6383 |
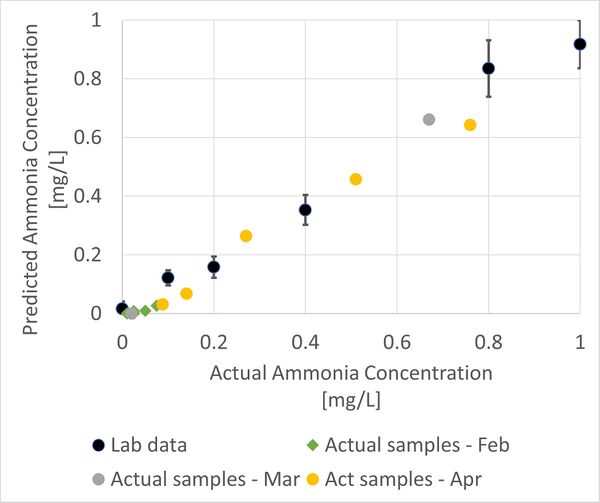
14 April 2023
An experiment was conducted to test the ammonia levels in water samples with turbidity of 0, 10, 20, 35, 80, 160 and 250. The data collected were then compared to the results obtained in experiments conducted in February and March as well as the lab data. Currently, the lab data coincides with the actual ammonia concentration in the samples and future works include testing for samples with ammonia concentration of more than 1mg/L. The comparisons were shown in the graph below.
