Difference between revisions of "In Water Vel Sensor"
| Line 227: | Line 227: | ||
Heterodyne FFT.png|FFT of Heterodyne Circuit with 40 KHz Ultrasonics | Heterodyne FFT.png|FFT of Heterodyne Circuit with 40 KHz Ultrasonics | ||
</gallery> | </gallery> | ||
| + | |||
| + | ==== 1.7 MHz Tranducers ==== | ||
Revision as of 02:56, 3 December 2019
This section documented our journey to develop a low-cost water velocity sensor based on doppler effect!
Contents
20th November 2019
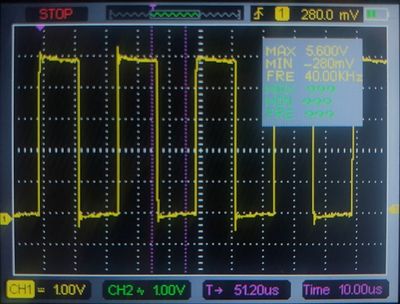
So the first task we are going to try is to use Arduino to generate 40 kHz square wave and emit that signal by using a ultrasonic transducer.
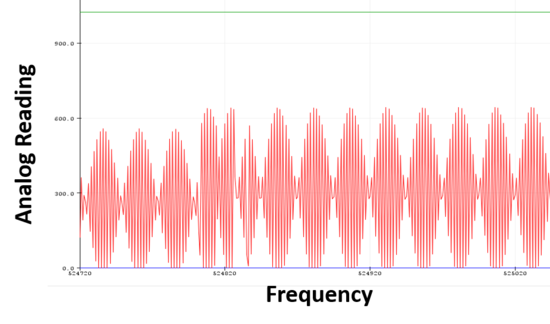
By facing another same transducer to the one emitting the ultrasonic signal, we can successfully detect that signal.
Figures below show the generated square wave from the emitting transducer (measured by an oscilloscope), and the detected wave signal from the receiver transducer (by using AnalogRead).
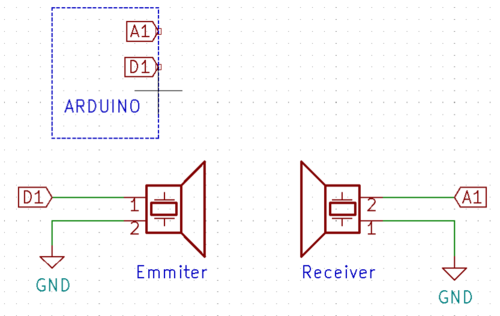
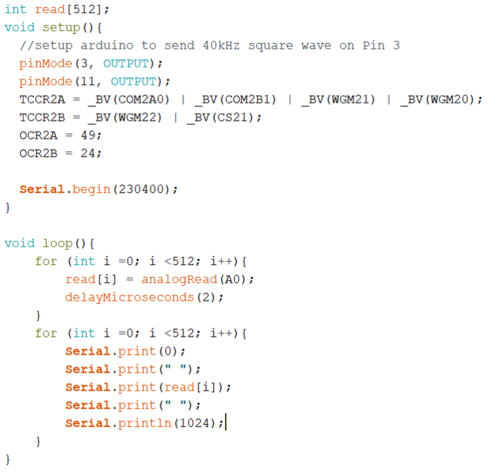
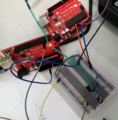
The figure here shows how we wire up the transducers with Arduino to conduct this quick test. The code we used is also attached here to show you how to use Arduino to generate a certain frequency.
21th November 2019
What are we going to try today is to place the two transducers next to each other and facing the same direction.
One emit the signal to a metal wall, and the receiver to detect the signal bounce back.
Multiple op-amps will be used to strength the signal to make it strong enough for Arduino to detect.
25th November 2019
For the arduino to effectively read the low amplitude high frequency signals it is going to need some assistance via external circuitry.
We tested an non-inverting op-amp design based on the LM324. This proved to have challenges reproducing the high frequency signals and after some diagnosis, we determined that the slew rate of the LM324 was too low.
The image above shows the limited slew rate experienced from the LM324N. In this domain the waveform appear as linear as the OpAmp attempts to match the proper signal. It demonstrated a slew rate of about 0.5 V / μS. To overcome this we will need to replace the LM324N with a better OpAmp.
By default the Arduino ADC sample frequency is rather slow at 45 kHz. For our application we will need much faster sampling rates. Fortunately, the clock divider which the ADC runs on (default 32x) is user settable. In testing various values for this, a sample rate of 615 kHz was able to be achieved. <1>
This was accomplished via the following code:
26th November 2019
We tested out some LM883N and NE5532AP OpAmps to see if they performed better than the LM324 (they have a slew rating of ~5 V / μS so they should). Both worked much better than the LM324 being able to reproduce the waveform however, we found that the NE5532AP was better at higher gains.
It was found that the circuit below performed well at amplifying the AC signal of the receiver resonator.
The gain can be adjusted through resistors Ra and Rb via the formula: Gain = 1 + Ra/Rb
Issues were faced where very high noise was present on the output of the op-amp. Some investigation revealed that this was due to the same Arduino driving the 40 kHz squarewave as powering the op-amp. This limited the ability to receive low amplitude signals and made it difficult to detect the reflected ultrasonic waves. A temporary solution to this was to use separate Arduinos for the transmitted and receiver.
A noise profile was obtained by having the ultrasonic receiver covered and placed such that no ultrasonic frequencies would be measured by it. The op-amp output was then measured. Below are the measurements for the two-Arduino setup vs the one-Arduino setup.
The noise is improved in the two-Arduino setup however there is still a significant ammount, it may be necessary to make a PCB with better noise isolation for test which require higher sensitivity.
Arduino Sample Frequency
<1> From doing more test it appears that not all Arduinos are able to sample at the 615 kHz rate, a more reliable max appears to be 215 kHz.
Testing the values of the clock divider registers ADPS2, ADPS1, ADPS0, the following table was made indicating about the various sample frequency on a 16 MHz 5 V ATmega382P (Arduino Uno).
| ADPS2 | ADPS1 | ADPS0 | Sample Frequency (kHz) | Working |
|---|---|---|---|---|
| 0 | 0 | 0 | 325 | No |
| 0 | 0 | 1 | 325 | No |
| 0 | 1 | 0 | 215 | Yes |
| 0 | 1 | 1 | 125 | Yes |
| 1 | 0 | 0 | 66 | Yes |
| 1 | 0 | 1 | 35.6 | Yes |
| 1 | 1 | 0 | 17.6 | Yes |
| 1 | 1 | 1 | 8.9 | Yes |
Arduino Frequency Measurement
To measure frequency an DFT was performed on a 128 size sample at 215 kHz of the amplified ultrasonic receiver signal.The sample frequency was chosen as it was the highest stable, and the sample size as this was the limit of the ATmega382p's memory.
The y-axis height represents strength of that component frequency, and the x-axis the frequency bins, where eight bins corresponds to 1.7 kHz
Concerningly the peak height is at about 90 kHz, and the predominant frequency when measured with an oscilloscope is 40 kHz.
27th November 2019
Some thought was conducted into the feasibility of direct frequency measurement using the ATmega328p and extracting the Doppler shift digitally.
The velocity is given by the equation: v = c/2 (fd/f) cos(θ), where c is the speed of sound, fd is the Doppler shift, f is the emitted frequency, and θ is the angle between the flow and sensor.
Let us assume that the sensor is parallel to the flow (θ = 0). By Nyquist-Shannon sampling theory, to detect a frequency at f we need the ATmega328p to sample at 2f. Applying a DFT to this sample gives a frequency resolution Δf of 2f/N, where N is the number of samples. Therefore, making the substitutions fd = 2f/N, θ = 0, we get: Δv = c/2 (2f/(f*N)) = c/N
For water (c = 1500 m/s) and a velocity resolution of Δv = 0.1 m/s this implies that 15 000 samples would need to be taken. This would require an amount of memory well beyond the 2 kB of the Arduino (which can realistically only store 128 samples).
This implies that direct measurement of the Doppler shift is not feasible and that some signal pre-processing is necessary. The idea is to extract the Doppler shift so that we can have a easier time sampling the lower frequency Doppler shift signal.
There are two approaches which we are going to trial, amplitude demodulation, and a heterodyne converter.
Amplitude Demodulation
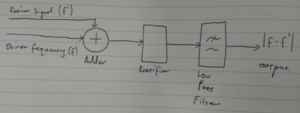
The premise of the AM demodulator is that the sum of the two signals produces a beating frequency (f' - f) which is conveniently also the Doppler shift fd. The rectifier eliminates the negative peaks of the resultant sum, and the low pass filter blocks the high frequency carrier wave of the signal, leaving only the low frequency Doppler shift.
The draw back of this method is that the signal is very weak, and it is difficult to scale to higher frequencies.
A pathfinder version of this circuit was constructed as indicated in the diagram. The inputs were provided by two Arduino Unos with one generating a 40 kHz 5Vpp Square wave, and the other a 43.4 kHz square wave. The output as measured by an oscilloscope was good, displaying an about 3.4 kHz wave which was the difference in the two frequencies. The output was however, a bit noisy, and low in amplitude (~500 mV). Building this on a proper PCB should help eliminate some of the noise and allow the output to be amplified.
The 43.3 kHz Arduino was then disconnected from the circuit and the ultrasonic transducers were wired into the circuit, (with some appropriate changes to the resistor values). The transducers were then placed so that they were facing each other and then the receiver was moved back and forward at a steady rate. The output of the demodulator was able to detect the Doppler shift and thus this motion, however much noise was present and the signal was weak.
Heterodyne Pre-Processing
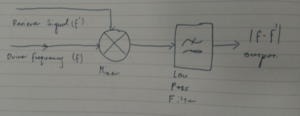
The Heterodyne is more standard for high frequency Doppler shift applications, the mixer multiplies the two signals. For two sine waves with frequencies fa and fb, their product will be the sum of cosines with frequencies |fa-fb| and |fa + fb|. For fa = f', and fb = f, the lower frequency signal is the Doppler frequency, which can then be isolated from the higher frequency using a low pass filter. This method provides the advantage of it being proven to work at a wide range of frequencies, in excess of 500 MHz.
28th November 2019
Following on from yesterday, I tested to see if the Arduino could analyse the output of the AM demodulator circuit. The output of the circuit was connected analog pin A1, and the below code was run.
The code, generates a 40 kHz 5 Vpp square wave on pin 3, then samples at 100 Hz on pin A1 for 128 samples. This data is then passed on the arduinoFFT library when does a DFT on the data to convert it into the frequency domain. The frequency domain data is then plotted to serial.
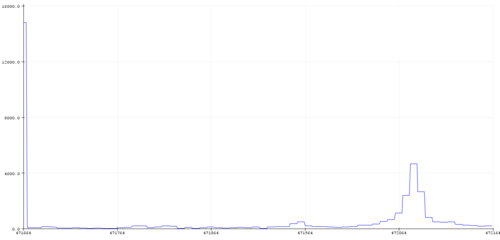
Running this code while moving the ultrasonic sensor at about 4 cm/s. The FFT in the gallery was the output.
The peak is seen at about bin 10. The bin frequency is given by fb = fs/N, where fs is the sampling rate (100 Hz in this case) and N the number of samples (128). This gives a bin frequency in our case of 0.78 Hz. As we are interested in bin 10, our Doppler frequency is 7.8 Hz.
Using the formula: v = c/2 (fd/f) => v = 340/2 (7.8/40 000) => v = 3.3 cm/s
Which is within our margin of error for the velocity, and indicates that the principle behind the sensor is as observed.
AM Demodulator PCB
PCB drawn up to take the AM demodulator off the breadboard and hopefully reduce some noise. Off to the Voltera!
Note: C1 was changed to from 1 μF to 100 nF as it had better performance.
The circuit works well, much the much better noise floor creates greatly improves the signal to noise ratio. The signal is still a bit weak however some more amplification may help this out. An oscilloscope is able to detect the Doppler shift when the transducers are facing each other and one is moved from about 1 meters distance, and from about half a meter when the signal is bounced off a wall. It is hoped that optimization of the values of the components can improve on this.
Additionally, it still needs to be tested if the Arduino can detect the signal from this.
When the traducers are facing each other, the Arduino is able to read the voltage and perform the analysis on it. Below is an FFT plot from the Arduino in this arrangement.
Wrote some code to use the frequency data to determine the speed. Initial tests indicate its working well, although a proper trial with calibrated speed references will be necessary to be sure if its working properly.
29th November 2019
Some tuning was done to the AM demodulator circuit to improve performance. One issue found when probing with the oscilloscope is that the output of the opamp was being clipped as the amplification was too large, and so the resistor R6 was changed to 5 kΩ to prevent this.
3rd December 2019
Some testing was done into if it would be possible for an Arduino to produce a 1 MHz frequency, which will be needed if we want to switch to a 1 MHz transducer. It was able to generate the waveform, however, significant ringing did occur on the rising and falling edge. This may be able to be alleviated with a capacitor if it becomes an issue.
Heterodyne Circuit
In order to switch to using higher frequencies the heterodyne circuit topology is going to be needed. A circuit based on the SA612AD is going to be build according to this schematic.
Building this circuit, it seems to perform effectively, and with a output signal much cleaner and stronger than the AM demodulator. The waveform in the gallery was taken with the two 40 KHz ultrasonic sensors pointing towards a wall about 30-50 cm away. The amplitude of the signal being about 80 mV should be able to be detected by the Arduino, however if not the output signal is SNR is low enough that amplification could be done. Furthermore, it seems as though the low pass filter has a much easier time of isolating the low frequency component of interest when compared to the AM modulator, another benefit of this design.
For two 40 KHz ultrasonic sensors facing each other at about a half a meters distance, the Arduino was used to record the output of the Heterodyne Circuit. The FFT of the signal is shown below. It is seen that the signal produces a much more distinct peak at the Doppler frequency, which will help the extraction of the velocity from this output.

