Difference between revisions of "Turbidity Sensor"
| (141 intermediate revisions by 5 users not shown) | |||
| Line 1: | Line 1: | ||
| − | + | == Publication== | |
| + | |||
| + | '''Please see the following link for the publication of the low-cost turbidity sensor | ||
| + | |||
| + | Website link: https://www.mdpi.com/1424-8220/24/12/3926 | ||
| + | |||
| + | PDF version:https://www.mdpi.com/1424-8220/24/12/3926/pdf''' | ||
| + | |||
| + | ==12th November 2019== | ||
So we finally made some nice progress with the Turbidity Sensor design. | So we finally made some nice progress with the Turbidity Sensor design. | ||
| − | + | The first step was to print our case using our 3D printer. Here it is: | |
[[File:TurbBoxV0.1.png|300px]] | [[File:TurbBoxV0.1.png|300px]] | ||
| Line 26: | Line 34: | ||
Over and out for today. | Over and out for today. | ||
| − | + | == 13th November 2019== | |
| − | So, today we began making our circuitry for the new turbidity sensor. It is looking good, but when we tried to print the board on our new PCB printer, the ink was all dried up! Come on Voltera, please send us the new ink so we can start printing our boards again! Here is an image of the circuit we made today in an easy to use program called EasyEDA. | + | So, today we began making our circuitry for the new turbidity sensor. It is looking good, but when we tried to print the board on our new PCB printer, the ink was all dried up! Come on Voltera, please send us the new ink so we can start printing our boards again! Here is an image of the circuit we made today in an easy to use a program called EasyEDA. |
[[File:BoSL Turb V.01.png|300px]] | [[File:BoSL Turb V.01.png|300px]] | ||
| − | + | == 17th November 2019 == | |
| − | We have begun designing our wiping device, but to do so we needed to revamp our circuit to allow for some motors to drive the wiping action. We began printing many different versions of the above board on our Voltera printer (thanks Voltera for finally giving us our consumables), but there were a hole bunch of issues...including that the holes and pads were not optimised for our Voltera. So, we spent the day designing a new circuit that now looks like... | + | We have begun designing our wiping device, but to do so we needed to revamp our circuit to allow for some motors to drive the wiping action. We began printing many different versions of the above-board on our Voltera printer (thanks Voltera for finally giving us our consumables), but there were a hole bunch of issues...including that the holes and pads were not optimised for our Voltera. So, we spent the day designing a new circuit that now looks like... |
[[File:BoSL Turb Probe v0.5.png|300px]] | [[File:BoSL Turb Probe v0.5.png|300px]] | ||
| Line 40: | Line 48: | ||
More to come from Miao in the next few days... | More to come from Miao in the next few days... | ||
| − | + | == 19th November 2019 == | |
This is Miao's turn for updating the process. | This is Miao's turn for updating the process. | ||
| Line 46: | Line 54: | ||
Based on Dave's experience, we started to do the calibration of the sensor. | Based on Dave's experience, we started to do the calibration of the sensor. | ||
| − | Now we don't want to use a deep cylinder for testing, as the glass cylinder is transparent, we designed a black box and printed it by our 3D printer. The box is designed to fit our sensor and it is 100% infill. | + | Now we don't want to use a deep cylinder for testing, as the glass cylinder is transparent, we designed a black box and printed it by our 3D printer. The box is designed to fit our sensor and it is 100% infill. Before we use the 100% infill black box, we have also done a waterproof test of the box. We fill some water in the box, and put the box on a piece of tissue, after 4 hours, we found that there is no water on the tissue. So it can be proved that the box should be waterproof. |
Also, Dave printed another sensor case, which is smaller than the previous one and it has bulgy edges, so it is easier to glue epoxy on the surface of the LED and PT. | Also, Dave printed another sensor case, which is smaller than the previous one and it has bulgy edges, so it is easier to glue epoxy on the surface of the LED and PT. | ||
| Line 54: | Line 62: | ||
So now we have two sensors, the big one which Dave used for testing and a small one with bulgy edges. | So now we have two sensors, the big one which Dave used for testing and a small one with bulgy edges. | ||
| − | After we wired the LED and PT for the small sensor, we tested that, it works and the | + | After we wired the LED and PT for the small sensor, we tested that, it works and the analogue reading is more than 400 in air. However, when we cover the epoxy piece on the surface, the reading number became 0 or a quite small number(less than 10). Now we use liquid epoxy to glue the epoxy piece on the sensor box, and we need to wait until the epoxy drys and then we will test it in water to see if it has any difference. |
To be continued…… | To be continued…… | ||
| + | == 20th November 2019 == | ||
| − | + | The liquid epoxy is dry and we put the sensor in DI water in the black box, the reading number changed to around 920, and when we get it out in the air, the number changed to 12. | |
| − | |||
| − | The | ||
Anyway, as it can be used for testing in water, we started dosing the solution for testing. | Anyway, as it can be used for testing in water, we started dosing the solution for testing. | ||
| − | We use DI water(0.18NTU) and another lab solution(807NTU) to | + | We use DI water(0.18NTU) and another lab solution(807NTU) to dose the solution, we change the testing solution's turbidity by adding more 807NTU solution into DI water and then record the analogue reading. |
| − | Solution with different turbidity was tested, the range is between 0. | + | Solution with different turbidity was tested, the range of the turbidity is between 0.18NTU and 807NTU. The step of the testing solution is different in different turbidity range. From 0.18 to 50 NTU, the step is 5NTU, and the step changes to 10NTU for the solution between 50-100NTU, from 100-200NTU, the step is 20 NTU, and from 200-1000NTU solution, the step is 100. Both the big sensor and small sensor are tested. |
[[File:Testing set up.jpg|500px|none]] | [[File:Testing set up.jpg|500px|none]] | ||
The results can be seen in the following diagram. | The results can be seen in the following diagram. | ||
| − | |||
| − | |||
| − | From the data, it can be seen the results is different from Dave's result. From 0.17 to 50NTU, the | + | [[File:Small sensor output reading.jpg|500px]] [[File:Large sensor output reading.jpg|500px]] |
| + | |||
| + | From the data, it can be seen the results is different from Dave's result. From 0.17 to 50NTU, the analogue readings are floating and do not have too much change, and from 60 to 300NTU, the outputs decrease in a narrow range, after that the reading number suddenly changed to a very small number. We also found that for both sensors, the output almost fits a straight line between 60 to 200NTU. | ||
| − | The difference between my results and Dave's | + | The difference between my results and Dave's may be caused by changing the solution container. We need to do more test and found the problems. |
To be continued…… | To be continued…… | ||
| − | + | == 21th Novermber 2019 == | |
As the results of the small sensor and the large sensor are different, we tested the two sensors to compare them. | As the results of the small sensor and the large sensor are different, we tested the two sensors to compare them. | ||
| − | We put both sensors in air, the | + | We put both sensors in air, the analogue reading of both sensors is about 12. However, when we put the small sensor in a black box(just in the air without touching the water), the reading is also around 12, and after touching water, the number changed to around 926. For the big sensor, when put it in the black box without touching water, the reading is around 800, and if it touches water, it becomes 926. |
I think the large sensor's results are more make sense, as the results in air and in DI water do not have a large difference. | I think the large sensor's results are more make sense, as the results in air and in DI water do not have a large difference. | ||
| Line 96: | Line 103: | ||
| − | + | == 23th Novermber 2019 == | |
Today we did two things: | Today we did two things: | ||
| − | 1. We repeated Dave's experiment(use the big sensor to do the experiment in a cylinder), 2. Recalibration(use the big sensor for testing, more accurate as we use | + | 1. We repeated Dave's experiment(use the big sensor to do the experiment in a cylinder), 2. Recalibration(use the big sensor for testing, more accurate as we use a real turbidity sensor to test the turbidity of each solution) |
| + | |||
| + | [[File:Recalibration of the tests.jpg|400px|none]] | ||
| + | |||
For the first experiment, we got a similar trend but a different result. | For the first experiment, we got a similar trend but a different result. | ||
| − | [[File:Repeating Dave's experiment.png|600px|none]] | + | [[File:Repeating Dave's experiment.png|500px|none]] |
| + | |||
| + | I think the reason we got a different result is that we cannot make all the configuration of the environment exactly as same as before, and the sensor is very sensitive to the configuration(the distance between the epoxy and PT) and the surrounding environment, as the epoxy we glued to the sensor case has changed, so it has a different result. | ||
| + | |||
| + | For the second experiment, we use the big sensor for recalibration, and all the solution are tested to double-check their turbidity before testing. | ||
| + | |||
| + | The results are different from previous experiments. | ||
| + | |||
| + | [[File:Recalibration.png|500px|none]] | ||
| + | |||
| + | The output results are between 860 to 900 for the solution between 0 to 200NTU, and the analogue output keeps floating, it does not have a specific trend. Therefore, it is not easy to calibrate the result with an equation. | ||
| + | |||
| + | Another problem is when we get the analogue reading for each solution, the reading numbers always have a floating vibration, I think it is a problem of the circuit. | ||
| + | |||
| + | Now the setting of our sensor reports different results in the same configuration, so it is difficult to duplicate the past experiment. We are thinking to change the setting of our sensor(change the resistor or change the sensor case or add some parts)………… | ||
| + | |||
| + | Need to search for more information to develop our sensor…… | ||
| + | |||
| + | |||
| + | == 27th November 2019== | ||
| + | |||
| + | As we still cannot get satisfactory results, we want to start to repeat the experiment on the paper and see if we can get the similar results, then we will find the difference between their settings and our design, then figure out the problem. | ||
| + | |||
| + | We did not get the exact same Acrylic tube, so we use the Vinyl tube with inner diameter 19mm to instead, and then we use our 3D printer to print a house of the sensor. The house can hold the tube in the centre and set LED on the top of the house and the PT on the side, so the LED and the PT are perpendicular to each other. | ||
| + | |||
| + | [[File:New sensor box and tube.jpg|300px|none]] | ||
| + | |||
| + | After that, we use the Clear Liquid Epoxy to glue the tube, LED and the phototransistor in the sensor house, the Liquid Epoxy is fully waterproofed and 100% transparent. Now waiting for it dry and test it tomorrow…… | ||
| + | |||
| + | [[File:Glued case for repeating test.jpg|600px|none]] | ||
| + | |||
| + | |||
| + | == 28th November 2019== | ||
| + | |||
| + | We do use the new sensor box for testing, the circuit is showed as following: | ||
| + | |||
| + | [[File:Paper circuit.jpg|400px|none]] | ||
| + | |||
| + | However, the resistor we use has changed, R1 is changed to 500ohm and R2 is 330k ohm. But by using these resistors, the results do not change too much as the solution changes. We have to change the circuit configuration. | ||
| + | |||
| + | The first thing we want to change is connecting the base to the ground. We think the base may perform as an amplifier, and it may affect the analogue reading of our sensor. To compare with the previous test, we increase the resistance of the base, so the resistor is changed to 6M ohm. Another thing is that we want to make the LED brighter, so we change the resistor connecting to the LED as 50ohm. Therefore, the circuit is like: | ||
| + | |||
| + | [[File:New right circuit.jpg|500px|none]] | ||
| + | |||
| + | We put the new black sensor in the glass cylinder for testing, for accuracy, we test the turbidity of each solution before the test. | ||
| + | |||
| + | [[File:Testing process of black sensor.jpg|500px|none]] | ||
| + | |||
| + | Then we got the result, it looks pretty much better than before, the result is the linear relationship between the output reading and the turbidity. | ||
| + | |||
| + | Now we sure that the resistor on the base has the critical effects, and we changed the resistor even larger(10M ohm), but the result is not as good as 6M ohm, as the reading in 1000NTU solution is about 1000, that's good, but the reading in air and in DI water is not 0, that's not what we want, so we need to try to find an optimal resistor later. | ||
| + | |||
| + | As we think we have found the critical factor, we just use the 6M ohm resistor on the base and then use the circuit to test the previous sensor(the red one with a piece of epoxy on the surface), we still put the red sensor in the black box, just as the same configuration as before, although the result is better than before, some results are still unreasonable, for example, in DI water, the analogue reading is 177 which is not 0. That means we still got some problem with our design, now we are thinking about how to change our sensor case and design. Also, the floating vibration problem still exists, we are planning to use our PCB printer to get a better board to get rid of this problem. | ||
| + | <gallery> | ||
| + | Repeating paper results 6M ohm.jpg|Repeating the paper experiment with 6M ohm resistor on the base | ||
| + | Repeating paper results 10M ohm.jpg|Repeating the paper experiment with 10M ohm resistor on the base | ||
| + | Old sensor with 6m ohm on base.jpg|Use old sensor with 6M ohm resistor on base for testing | ||
| + | </gallery> | ||
| + | |||
| + | To be continued…… | ||
| + | |||
| + | |||
| + | == 29th November 2019== | ||
| + | |||
| + | As we still want to use the wiper, so the black sensor case we used yesterday should be changed. We are wondering if half of the case can still work. Therefore, we use our 3D printer to print half of our case which is a triangular case. We also use the Liquid Epoxy to glue tube on the case, both the whole tube and half tube are used for testing. The settings are shown as the picture below. Also, our new board is printed out by our PCB printer, just waiting for the sensor ready and then test them. | ||
| + | |||
| + | [[File:Half case sensor settings.jpg|400px]] [[File:PCB printed board.jpg|400px]] | ||
| + | |||
| + | Just waiting for the Epoxy dry. | ||
| + | |||
| + | |||
| + | == 2nd December 2019== | ||
| + | |||
| + | Now we have two new sensors, one is a triangular case with half tube and another one is a triangular case with a whole tube, now we are going to use these two sensors for testing. | ||
| + | |||
| + | Firstly, we still use the same circuit for testing, and when we found the analogue reading is small, we changed the resistor which connected to the base. From the past experience, we found the analogue reading is getting larger as the resistor connected to the base increases, so we used 20M ohm instead of 6M ohm on the base. | ||
| + | |||
| + | The results can be seen as the following: | ||
| + | |||
| + | For the case with the half tube: | ||
| + | |||
| + | [[File:Half case with half tube 6M ohm.jpg|400px]] [[File:Half case with half tube 20M ohm.jpg|400px]] | ||
| + | |||
| + | From the result, it can be seen that the sensor with 6M ohm connecting base performs perfectly, and the results show a linear relationship between the output voltage and the turbidity. However, for the 20ohm sensor, it does not perform as good as the first one, so we won't use such a big resistor for our design. | ||
| + | |||
| + | For the case with the whole tube: | ||
| + | |||
| + | [[File:Half case with whole tube 6M ohm.jpg|400px]] [[File:Half case with whole tube 20M ohm.jpg|400px]] | ||
| + | |||
| + | The sensor with a whole tube shows a similar result, as the 6M resistor is better than the 20M ohm resistor. | ||
| + | |||
| + | Another thing is that we have test the 3.3v input, and we found the sensor does work with 3.3v input voltage, however, we need to do change our design to optimize the circuit performance. | ||
| + | |||
| + | |||
| + | Although the sensor with half tube works not bad, we still want to use the flat surface, more tests need to be done to find a better way for a flat surface. | ||
| + | |||
| + | |||
| + | == 3rd December 2019== | ||
| + | |||
| + | Now we need to think more and retest the previous experiment which using the flat sensor box. | ||
| + | |||
| + | Today we tested the performance of LED and the phototransistor with the different distance between the transparent epoxy and the parts. We use tape to make the LED and the phototransistor in a fix location, and then change the position of the transparent epoxy board. | ||
| + | |||
| + | [[File:Distance test setting.jpg|400px|Distance test setting]] | ||
| + | |||
| + | From the photo above, each unit is 5mm, when we made the LED and phototransistor face to face, the analogue reading is around 760 which is the largest number. Then we start to fix them in a specific location, then change the epoxy's location. Firstly, we make the transparent epoxy board touch the LED and the PT, the analogue is 0, and then we slowly make the epoxy far away from the two parts, in a certain distance the reading number became larger, and kept increasing until the intersection point, at that point, the reading number is 760 which is the largest number. After that, as the distance kept increasing, the number became decreasing and then became 0. Those results mean that: | ||
| + | 1. If the epoxy is as close as touching LED and the PT, the sensor does work; | ||
| + | 2. If the solution is within a certain distance away from the surface of LED and the PT, the turbidity of the solution can be detected by the sensor | ||
| + | 3. In a certain distance, the phototransistor cannot detect the reflected light from the LED, which means the sensor actually does not need a specific boundary condition, because the light cannot reach such far away distance. | ||
| + | |||
| + | From the results, we know that for the flat sensor box, we need to make the epoxy touch the LED and the PT, and this configuration makes the analogue reading is 0 in the air which means the setting of our previous design should be all right. Another thing is that we do not need a boundary condition in our design because the sensor can only detect the reflected light at a certain distance. | ||
| + | |||
| + | Now the transparent epoxy board we use is much clear than the epoxy we used before, the next step we need to use this board for further testing. | ||
| + | |||
| + | |||
| + | == 4th December 2019== | ||
| + | |||
| + | Today we are planning to test the sensor with a flat surface, and the epoxy needs to be glued on the surface of the sensor box. | ||
| + | |||
| + | At first, we used 100% infill white box for testing. The distance between the two holes is 20mm(centre to centre). | ||
| + | |||
| + | [[File:White sensor box front.jpg|300px]] [[File:White sensor box back.jpg|300px]] | ||
| + | |||
| + | At the beginning of the test, we just put the LED and the PT in the two holes to test if the analogue reading is 0 in the air. However, we found that the analogue reading is not 0 when the two little bulbs are in the holes, we took them out and found even they are perpendicular to each other, the reading is not 0. When we used the black box to hide the LED, the analogue reading is still not 0. We found that two problems cause this result, one is the light source of LED is not from the edge of the bulb but the inner part, so the light can penetrate the glass bulb and be detected by the PT. Another problem is that the white box is not light-proof, so the light from the LED can be transmitted from the white box and it can be detected by the phototransistor. That can also explain why the analogue reading is not 0 in the air for the previous test(by using the red sensor box). | ||
| + | |||
| + | Then we used the 100% infill black box to test if the light will transmit through, and we found that the light cannot be transmitted through the black box. | ||
| + | |||
| + | Therefore, to solve the problems, we determine to use our 3D printer to print the 100% infill black sensor box, and to get rid of the light transmitting from the internal part of the box, the sensor box is designed to have two tube at the back the two holes, the two tubes will cover the body of the two bulbs so that light can no longer transmit through the sensor box. | ||
| + | |||
| + | [[File:New sensor box with plastic tube.jpg|300px]] [[File:New sensor box with plastic tube back.jpg|300px]] | ||
| + | |||
| + | After we set up the sensor box, we glue the epoxy cover on the sensor box surface, and then start our test. The tested sensor is shown in the following photo: | ||
| + | |||
| + | [[File:New tested sensor box 3.3v.jpg|400px]] | ||
| + | |||
| + | In our test, when the sensor is exposed in air, the analogue reading is 0, and in DI water, it is also 0. It is a good result as it matches our hypothesis. However, when we put it in the solution with 200NTU, the analogue reading is about 10, and when we use 1000NTU solution for testing, the reading number is about 76, so the problem is that the reading number is too small for calibration. | ||
| + | |||
| + | We thought that the problem may be the PT is too deep in the box, so it can detect little light from the LED, next step we need to print another sensor box to make the PT more close to the surface. | ||
| + | |||
| + | To be continued…… | ||
| + | |||
| + | |||
| + | == 5th December 2019== | ||
| + | |||
| + | The first thing we need to do is make the tube at the back of the hole shorter, so the LED and the PT are closer to the surface and can touch the epoxy. | ||
| + | |||
| + | The sensor box we used yesterday is a black box with 20mm distance between two holes(centre to centre). Now we use a new sensor box with 14.3mm distance between two holes. We use 14.3mm distance because in the past experiment the tube diameter we used is 19mm, so the distance between the LED and the PT is about 14.3mm. So we test this distance to see the performance. The new case can be seen as the following photo: | ||
| + | |||
| + | [[File:New sensor box with led and pt.jpg|400px]] | ||
| + | |||
| + | And we also connect LED and the PT to the Arduino and found the analogue reading is 0 in air, and when we put the transparent epoxy on the surface, the reading number is also 0. That shows the sensor works well. Next step, we are going to print more sensor boxes with different distance between the holes, 12mm, 10mm and 8.5mm, and then test if the distance between LED and the PT will affect the performance, and then we will choose the best one and test in solution. | ||
| + | |||
| + | To be continued…… | ||
| + | |||
| + | |||
| + | == 6th December 2019== | ||
| + | |||
| + | Now we have a sensor box family! Sensor boxes with different distance between holes(8.5mm, 10mm, 12mm, 14.3mm). And we will use these boxes for testing. | ||
| + | |||
| + | [[File:Sensor box family.jpg|400px]] | ||
| + | |||
| + | ==== Distance testing ==== | ||
| + | |||
| + | We try to put the transparent epoxy board in front of the different boxes with different distance, and then see the analogue reading in different distance. The results showed that if the two holes are closed, the distance between the board and the sensor box to reach the maximum reading number is smaller. For example, for the 14.3mm distance box, when the board is 3mm away from the box, the reading number is 380, and the reading number changed to 650 at 4mm distance. However, for 8.5mm distance box, the reading number is 650 when the board is 1mm away from the box. | ||
| + | |||
| + | So, after the test, we found 14.3mm between the holes is too far away and 8.5mm is too close, so we choose 12mm box and 10mm box for testing. | ||
| + | |||
| + | ==== Solution testing ==== | ||
| + | |||
| + | We used 10mm distance box and 12mm distance box to get the analogue reading in the different solution. For the 10mm box, the readings are still 0 for the solution below 80NTU, and for the 1070NTU turbidity solution, the analogue reading is only 128. For the 12mm box, the number is even smaller, for 1070NTU turbidity is 48. That result cannot be used for analysis. We have also changed the base resistor from 6M ohm to 20M ohm, however, when the resistor is larger than 7M ohm, the reading number in air and DI water is no longer 0, that is not what we want. | ||
| + | |||
| + | We compared with the current design and the previous test design(with round tube in the box), the difference between these two designs is the transparent board, one is a flat board and another is a round tube, that means the LED and the PT have a certain angle between the board, but with the tube, they are perpendicular to the tube surface. So we want to have another test which makes the LED and the PT perpendicular to the epoxy board and see if it will get better. | ||
| + | |||
| + | ==== New sensor box testing ==== | ||
| + | |||
| + | We use our 3D printer to print a new sensor box which is shown below, this sensor box can also make the LED and the PT perpendicular to each other, and the epoxy board could also be glued on the surface of the box which makes the board perpendicular to the bulbs. And the distance between the two bulbs is 14.3mm which is as same as the previous testing box(with a round tube in the centre). Our hypothesis is that if this sensor works, that means the epoxy board should be set as perpendicular to the LED and the PT, so we can try to cut two small round epoxy board and set them into the two holes which are perpendicular to the two bulbs. | ||
| + | |||
| + | [[File:New testing box for perpendicular board.jpg|300px]] | ||
| + | |||
| + | To be continued…… | ||
| + | |||
| + | |||
| + | == 10th December 2019== | ||
| + | |||
| + | Today we used the L shape sensor box for testing. When we started our test, we got a serious floating vibration problem. When the sensor is exposed in air, the analogue reading is not 0, the range is between 8 to 21, and the numbers keep changing. | ||
| + | |||
| + | To solve this problem, we try to change the resistor on the base and on the emitter. For the base, when we changed the resistor from 6M ohm to 4M ohm and then 1M ohm, the analogue reading number became smaller but still not 0, and the floating vibration problem still exists. We have also changed the PCB board to the breadboard, but the situation did not change. The resistor on the emitter has also changed, however the analogue reading did not change too much. | ||
| + | |||
| + | At last, we used a new LED and a new phototransistor which are soldered by new wire, this wire we used is thicker and more rigid than that we used before. After we changed that, the analogue reading in the air is constantly 0. However, when we face the PT to the lamp, in a certain angle, the reading increases. | ||
| + | |||
| + | Now we found that the floating vibration problem may be caused by the wire, and the lamp may emit light which can be detected by the phototransistor, and that problem may affect the results of our experiments. | ||
| + | |||
| + | In the following test, we still need to use a black box for solution container to avoid noise from the lamp or other light sources. | ||
| + | |||
| + | To be continued…… | ||
| + | |||
| + | |||
| + | == 18th December 2019== | ||
| + | |||
| + | New update for our turbidity sensor. | ||
| + | |||
| + | Now we need to continue testing the last sensor with L shape sensor box. This time, to avoid the noise from the breadboard, we would not connect the resistors in the breadboard, instead, we will solder the resistor on the pins. Apart from that, to get rid of the noise from the lamp or the laptop screen, the solution will be contained in a black box which is printed by our 3D printer, and the cap of the black box is also printed. That cap will cover the top of the box, only one small hole will sit on the cap to allow the cables to come out, with this configuration, the noise from the other light source will almost be eliminated. | ||
| + | |||
| + | Just wait for the 3D printer completing the printing task, and then we can use the case and the container for testing. | ||
| + | |||
| + | To be continued…… | ||
| + | |||
| + | |||
| + | |||
| + | == 19th December 2019== | ||
| + | |||
| + | All the facilities for testing are completed this morning, as usual, we still use the liquid epoxy to glue the plastic board on the sensor case, and then pouring the liquid epoxy at the back of the LED and the phototransistor so that the sensor is fully water-proof. When testing the sensor, the solution container will be covered by the cap. The testing facilities can be seen as the following pictures: | ||
| + | |||
| + | |||
| + | |||
| + | [[File:L shape sensor testing1.jpg|200px]] [[File:L shape sensor testing2.jpg|200px]] [[File:L shape sensor testing.jpg|200px]] | ||
| + | |||
| + | |||
| + | This time, the thick wire and the black container with a cap are used to avoid the noise. As a result, the analogue reading is much stable than before. When we put the sensor in the black box and covered with the cap, the analogue reading is constantly 0, and the reading number is also 0 in DI water, the floating vibration problem is almost disappeared. | ||
| + | |||
| + | By testing different solution, the results are shown in the table: | ||
| + | [[File:L shape sensor testing result.jpg|500px|right]] | ||
| + | {| class="wikitable" | ||
| + | |- | ||
| + | ! Media(NTU) !! Analogue reading | ||
| + | |- | ||
| + | | Air(in black box) || 0 | ||
| + | |- | ||
| + | | 0.18 || 0 | ||
| + | |- | ||
| + | | 62 || 0 | ||
| + | |- | ||
| + | | 82 || 0 | ||
| + | |- | ||
| + | | 165 || 26 | ||
| + | |- | ||
| + | | 432 || 198 | ||
| + | |- | ||
| + | | 600 || 220 | ||
| + | |- | ||
| + | | 1036 || 352 | ||
| + | |} | ||
| + | |||
| + | |||
| + | |||
| + | |||
| + | The problem is that the analogue reading number is too small for the solution below 100NTU(almost 0), so it is not suitable for stormwater monitoring. | ||
| + | |||
| + | The reason may be the light source is not strong enough, we need to change some settings to let the light source stronger. For example, the successful sensor insert the tube in the middle of the case and the tube can congregate the light as a concave lens, can we use concave lens on the top of the LED to get the light source together? | ||
| + | |||
| + | We will try to do this kind of thing. | ||
| + | |||
| + | To be continued…… | ||
| + | |||
| + | |||
| + | ==20th January 2020== | ||
| + | |||
| + | We got the new update of our turbidity sensor development. | ||
| + | |||
| + | Now we have done several tests: distance test, LED resistor test, and the PT base resistor test. | ||
| + | |||
| + | Now we are using our new turbidity sensor board, this board is small and easy to connect all the pins when testing, and the analogue reading output is also more stable than the breadboard, the following picture shows our new board. | ||
| + | |||
| + | [[File:Sensor board pcb.jpg|300px]] | ||
| + | |||
| + | To make sure the LED and the PT sit at the fix position, we used our 3D printer to print a rail and the LED and PT holder, the holder can move on the rail and stand at a fixed position, as the following figure shows. | ||
| + | |||
| + | [[File:Rail and holders.jpg|500px]] | ||
| + | |||
| + | For all the test we did this time, we just put the LED and the PT in the holders and change some factors(distance, resistors, type of LED) to see what factor affects the results most. By this configuration, the closest distance between the LED and the PT is 6mm, that means at 6mm distance, the edges of the holders touch each other. And for the circuit, the input voltage is 5V. This time we did not glue the epoxy on the holder. | ||
| + | |||
| + | |||
| + | ==== Distance test==== | ||
| + | |||
| + | Experiment Description: To test which distance will affect the analogue reading of the LED and the PT. We use the 6 degrees angle LED(brought from digikey), and use 51ohm resistor connecting to the LED, for the phototransistor, connecting 1M ohm resistor on the emitter, and connecting 5M ohm resistor on the base. By changing the distance between the LED and the PT(centre to centre) in the air, and use the cardboard box to cover them(making dark environment and avoiding noise), then record the analogue readings to see what the closest distance can be used between them. The closest distance means when we put them in the air, the analogue reading should be 0. | ||
| + | The results for this circuit configuration is in the table below: | ||
| + | {| class="wikitable" | ||
| + | |- | ||
| + | | Distance(mm) || 6 || 7 || 8 || 9 || 10 | ||
| + | |- | ||
| + | | Analogue reading || 20 || 0 || 0 || 0 || 0 | ||
| + | |} | ||
| + | |||
| + | [[File:Distance test results.jpg|400px]] | ||
| + | |||
| + | That means for this configuration, the closest distance should be 7mm(centre to centre). | ||
| + | |||
| + | ==== LED resistor test==== | ||
| + | |||
| + | Experiment Description: As the last test shows when put the PT and the LED within 6mm distance, it has analogue reading. We just use this distance, and change the resistor on the LED, and then see how the analogue reading changes. We still use the 6 degrees angle LED, and the 1M ohm resistor on the emitter, 5M ohm resistor on the base. | ||
| + | |||
| + | The results are shown in the table below: | ||
| + | {| class="wikitable" | ||
| + | |- | ||
| + | | LED resistor(ohm) || 10 || 20 || 50 || 100 || 200 | ||
| + | |- | ||
| + | | Analogue reading || 200 || 100 || 20 || 0 || 0 | ||
| + | |} | ||
| + | |||
| + | [[File:LED resistor test results.png|400px]] | ||
| + | |||
| + | This result shows that in this configuration, if the resistance of the LED circuit decreases, the analogue readings increase, which also means that the LED is brighter. '''However, when we use 10 ohm resistor for the LED circuit, the resistor is super hot that even hand cannot touch it. | ||
| + | ''' | ||
| + | |||
| + | ==== PT base resistor test ==== | ||
| + | |||
| + | Experiment description: From the LED resistor test, the analogue reading in 10 ohm resistor is 200 which is a large number, so we just use the resistor as 10 ohm which will obviously show the changes of analogue reading when we change the base resistor. In this test, we change the base resistor from 2M ohm to 20M ohm, and the analogue reading also changes, the reuslts are shown in the following table. | ||
| + | |||
| + | {| class="wikitable" | ||
| + | |- | ||
| + | | Base resistor(Mohm) || 2 || 5 || 7 || 10 || 20 | ||
| + | |- | ||
| + | | Analogue reading || 30 || 200 || 300 || 380 || 860 | ||
| + | |} | ||
| + | |||
| + | [[File:Base resistor test result.jpg|400px]] | ||
| + | |||
| + | This result shows that as the base resistor increases, at the same configuration, the analogue readings increase, and we need to choose a right resistor to make the analogue reading is 0 in air within a certain distance between LED and the PT. | ||
| + | |||
| + | To be continued...... | ||
| + | |||
| + | |||
| + | == 22 January 2020 == | ||
| + | |||
| + | ==== LED number changing test ==== | ||
| + | |||
| + | Experiment description: As we try to make the LED brighter, so we are thinking to add the number of LED, now we use two LEDs in the circuit, and the two LEDs are vertically set in a new LED holder. In the circuit, the resistor for the LEDs is 50 ohm, by changing the distance, record the analogue reading and compare with the results of the distance test. | ||
| + | |||
| + | {| class="wikitable" | ||
| + | |- | ||
| + | | Distance(mm) || 6 || 7 || 8 || 9 || 10 | ||
| + | |- | ||
| + | | Analogue reading || 40 || 40 || 28 || 0 || 0 | ||
| + | |} | ||
| + | |||
| + | [[File:LED number test.jpg|400px]] | ||
| + | |||
| + | |||
| + | From the result, it can be seen that, with two LEDs, the analogue is doubled at 6mm distance and it also has readings at 7mm distance and 8mm distance, which means more LED will make the light source brighter. Next test, we will change the configuration for further test:1. make the LEDs horizontally beside each other 2. change the LED resistor to 10 ohm and see the performance. | ||
| + | |||
| + | |||
| + | ==== Different LED test==== | ||
| + | |||
| + | Experiment description: Now we have four types of LEDs: LED with 6 degrees(from Digikey), LED with 15 degrees(from China), LED with 30 degrees(from China), LED with 60 degrees(from China). Now we need to test the impact by using different angles. This time we use 10 ohm resistor LED, 5M ohm resistor on base, 1M ohm resistor on emitter. The distance between the LED and the PT is 6mm. The result is shown below. | ||
| + | |||
| + | {| class="wikitable" | ||
| + | |- | ||
| + | | LED Angle(degree) || 6 || 15 || 30 || 60 | ||
| + | |- | ||
| + | | Analogue reading || 200 || 120 || 250 || 950 | ||
| + | |} | ||
| + | |||
| + | [[File:Different LED test result.jpg|400px]] | ||
| + | |||
| + | From the result, we can see that, the LED from Digikey is different from the Chinese LEDs, for the Chinese LEDs, as the angle increases, the analogue reading also increases. To make the analogue reading large enough in the low turbidity solution, I think we need to choose a large angle LED for testing. | ||
| + | |||
| + | Next tests, we will try to test the different angles between the LED and the PT, NOT ONLY FOR 90 DEGREES BETWEEN THEM. And we also need to do tests in water to see how the sensors perform in water. | ||
| + | |||
| + | To be continued…… | ||
| + | |||
| + | |||
| + | == 24th January 2020 == | ||
| + | |||
| + | We have repeated the PT base resistor test, this time we not only change the resistors connecting to the base, but also change the distance and the resistor on the LED. This time we make the distance at 6mm and 8mm, and the resistor on the LED are 10ohm and 50oh. And other configuration of the circuit did not change. | ||
| + | |||
| + | The results can be seen as the table below: | ||
| + | {| class="wikitable" | ||
| + | |- | ||
| + | | Base Resistor(ohm) || 2M || 5M || 7M || 10M || 20M | ||
| + | |- | ||
| + | | 6mm distance 10ohm LED || 30 || 200 || 300 || 380 || 860 | ||
| + | |- | ||
| + | | 6mm distance 50ohm LED || 0 || 20 || 50 || 90 || 280 | ||
| + | |- | ||
| + | | 8mm distance 10ohm LED || 26 || 120 || 380 || 500 || 950 | ||
| + | |- | ||
| + | | 8mm distance 50ohm LED || 0 || 0 || 5 || 100 || 330 | ||
| + | |} | ||
| + | |||
| + | [[File:Multiple test results 1st.png|600px]] | ||
| + | |||
| + | This result also shows that with the same configuration, if the distance is larger, the analogue reading is smaller, and in the same distance and resistor on base, if the resistor on the LED is larger, the analogue reading is smaller, and also the larger the resistor on the base, the larger the analogue reading it is. | ||
| + | |||
| + | I think the next step, we need to use two LEDs for testing as they may have larger analogue readings, maybe we should use 8mm as the distance, and try to do the experiment in the solution(maybe 200NTU solution), see how it will perform. | ||
| + | |||
| + | Will start the new experiment very soon. | ||
| + | |||
| + | |||
| + | |||
| + | == 4th February 2020 == | ||
| + | |||
| + | Today we are going to do the reflection test. We want to see what the analogue reading will be if we put some materials in front of the LED and the PT with different distance. Now we choose two kinds of materials, both of them have rough surface, one is the washing sponge and another is the face mask. Now the setting of the circuit is: the distance between the LED and the PT is 8mm, the resistor on the LED is 51ohm, and the resistor on the base is 5M ohm, the resistor connecting the emitter is 1M ohm. For the LED, we use 6 degree angle LED from the digi-key, the following figures shows the sponge and the face mask. | ||
| + | |||
| + | [[File:Face mask.jpg|200px]] [[File:Washing sponge.jpg|200px]] | ||
| + | |||
| + | And the test results are shown below: | ||
| + | {| class="wikitable" | ||
| + | |- | ||
| + | | Distance from the LED and the PT(mm) || 0 || 1 || 2 || 3 || 4 || 8 || 10 || 12 | ||
| + | |- | ||
| + | | Green sponge analogue reading || 1003 || 1003 || 1003 || 980 || 450 || 75 || 10 || 0 | ||
| + | |- | ||
| + | | Face mask analogue reading || 1003 || 1003 || 1003 || 990 || 639 || 34 || 0 || 0 | ||
| + | |} | ||
| + | |||
| + | In the test, we we take the analogue, we make sure that the LED and the PT are in a dark environment, and without the reflect material, the analogue reading is constantly 0. | ||
| + | |||
| + | |||
| + | == 10 February 2020 == | ||
| + | |||
| + | Now we think that the main problems for our turbidity sensor are two things: | ||
| + | |||
| + | 1. When we use the epoxy board on the surface of the sensor box, the light would transmit from the board and it can be detected by the phototransistor, to solve this problem, we need to make the light polarized. And we can redesign the sensor box which adds a barrier in the middle of the two holes, if so, the light cannot transmit by the epoxy board. The new sensor box looks like the following picture: | ||
| + | |||
| + | [[File:Hide in middle sensor box.jpg|300px]] | ||
| + | |||
| + | |||
| + | 2. After double-checking the mechanism of the existing turbidity sensors, it seems that all the light beam is a direct light beam without angle. Previously, the light from the LED is divergent light, and it may cause the phototransistor receives light from different directions, and maybe the floating vibration is also caused by this problem. To solve this problem, many designs use a lens in front of the LED to make the light concentrated, some designs also add a lens in front of the phototransistor as well. We try to design our new sensor box by adding a small hole in front of the LED, so the light from the LED may transmit from the little hole, maybe this light will be a direct light beam. | ||
| + | |||
| + | [[File:Small LED hole design front.png|300px]] [[File:Small LED hole design back.png|300px]] | ||
| + | |||
| + | |||
| + | Now we are printing the new box by our 3D printer, after it completed, we may use the epoxy to glue a new board on the surface of the box, and then test them in the water, see what will happen. | ||
| + | |||
| + | To be continued...... | ||
| + | |||
| + | |||
| + | == 13 February 2020 == | ||
| + | |||
| + | Until now, our turbidity sensor's analogue reading still got the fluctuation problem, sometimes the analogue reading fluctuates within a very big range, it is very difficult for us to get an accurate result. When doing an experiment, we found that the Arduino board and the LED is getting hot after a long-time work. So we thought the fluctuation problem may be caused by the unstable light source, as the Arduino and LED are getting hot, they are not in a normal working condition, if so, the LED may not emit the stable light. Therefore, we are planning to use another power supplier for the LED, to get rid of long-time working, we also use a relay in the LED circuit, the relay can make the LED work intermittently. | ||
| + | |||
| + | After we set up the circuit, we use the round hollow section turbidity sensor for testing, the sensor still got the fluctuation problem, so it seems that the problem is not caused by the unstable light from the LED. | ||
| + | |||
| + | We need to use other ways to solve this problem, to be continued…… | ||
| + | |||
| + | |||
| + | |||
| + | == 14 February 2020 == | ||
| + | |||
| + | Now we still use the external power supply for the LED and looking for ways to solve the fluctuation problem. We tried to add a "pull up" function in our code to make the PT work better. After we upload our new program to the Arduino, the Analogue reading results are much more stable than those in the previous test. All the results fluctuate in a very narrow range which means we almost solve the fluctuation problem. | ||
| + | |||
| + | Now we use the round hollow section turbidity for testing, and the circuit we use is Dave's circuit, which has 2M ohm resistor on the collector and 1M ohm resistor on the base. In this test, we found that the analogue reading is too large for all the solution, for example, the reading number for DI water is about 990, and the reading number is about 900 in the 500NTU solution, that is difficult for us to analyse the results. We need to change some configurations to make the results perfect. | ||
| + | |||
| + | To be continued…… | ||
| + | |||
| + | |||
| + | == 16 February 2020 == | ||
| + | |||
| + | We found that the analogue reading is very sensitive to the current of the LED, if we have a tiny change of the LED current, the analogue reading changes a lot. Therefore, we connect a multimeter to the circuit to measure the accurate current of the LED. Then we change the resistors on the base and collector. After we tested many times, we found that one configuration for the round hollow section turbidity sensor works very well, the results of different turbidity solution got a linear trend. | ||
| + | |||
| + | In this configuration, the resistor on the base is 4M ohm, and the resistor on the collector is 2M ohm, the current of the LED 0.1A. The result is shown in the following diagram: | ||
| + | |||
| + | [[File:Turbidity sensor results 0216 dave.jpg|450px]] | ||
| + | |||
| + | Now we can use this configuration for more test, but first thing we need to do is repeat the test and make sure it is reproducible. | ||
| + | |||
| + | |||
| + | ==17 February 2020 == | ||
| + | |||
| + | Today we repeat yesterday's experiment. However somethings changed: | ||
| + | |||
| + | 1. Today we make all the turbidity solution in the container, the container is a black box printed by our 3D printer and the black box can make sure the sensor will be in an absolutely dark environment; | ||
| + | 2. We use our turbidity meter to test each solution to make their turbidity accurate; | ||
| + | 3. In the first two tests, the current is 0.1A, however, the results are different, and the current always changed by itself, so in the third test, the current was changed to 0.13A and the results are better. | ||
| + | |||
| + | The following diagram shows the test results, the first two diagrams are results in 0.1A current, and the third one is under 0.13A current. | ||
| + | |||
| + | [[File:1st repeat 0217.jpg|450px]] [[File:2nd repeat 0217.jpg|450px]] [[File:3rd repeat 0217.jpg|450px]] | ||
| + | |||
| + | The following things need to be done are: | ||
| + | |||
| + | 1. Keep repeating the hollow section experiment, and make sure this experiment is reproducible; | ||
| + | 2. Try to use a flat case for testing. | ||
| + | |||
| + | To be continued…… | ||
| + | |||
| + | == 19 February 2020 == | ||
| + | |||
| + | The experiment is tested every day to see if it can get the same result, the results for yesterday and today are shown below: | ||
| + | |||
| + | [[File:Repeat 0218.jpg|450px]] [[File:Repeat 0219.jpg|450px]] | ||
| + | |||
| + | |||
| + | == 20 February 2020 == | ||
| + | |||
| + | Today we have done two things: | ||
| + | |||
| + | ==== Repeat the previous experiment ==== | ||
| + | |||
| + | The previous test had been repeated for one more time today, the configuration was as same as the previous test, use 2M ohm resistor on the collector, 4M ohm resistor on the base and use 0.13A current for the LED, the results are shown below: | ||
| + | |||
| + | [[File:Repeat 0220.jpg|450px]] | ||
| + | |||
| + | This result is similar to the past two days' results, which means the experiment can be replicated. | ||
| + | |||
| + | ==== Try to use the flat turbidity case for testing ==== | ||
| + | |||
| + | As we replicate the experiment successfully, we try to use the falt turbidity case for testing. For the flat case, the distance between the two holes on the case is 19mm, and the epoxy board is about 1.5mm thickness, we use the glue gun to glue the transparent epoxy board on the case, and test the case in different turbidity solution. The circuit is as same as the circular case, the only difference is to the LED and the PT in a falt case. We test the falt one in different turbidity solution, the result is shown below. | ||
| + | |||
| + | [[File:Flat case results bad.jpg|450px]] | ||
| + | |||
| + | Although the points look like a linear relationship. the differential rang is too small(from 995 to 1006), so the result is not good enough. | ||
| + | |||
| + | Now we want to try to change our settings of the circuit, we use a 500K potentiometer connecting on the collector, and then disconnected the base, then try to see the analogue reading. We found that, the analogue reading increases as the resistance increases. However the analogue reading for 500K ohm is still more than 70, so we changed the current of the LED to 0.25A, the reading numbers changed to 135 for the 500k resistance. So we changed the resistor to a larger one, 2M ohm resistor made the analogue reading 561 at 480NTU solution. The results can be seen in the following diagram: | ||
| + | |||
| + | [[File:Base disconnected.jpg|350px]] [[File:6 points results 0220.jpg|450px]] | ||
| + | |||
| + | However, if we only use the first 5 points for plotting, there was a better linear trend: | ||
| + | |||
| + | [[File:5 points results 0220.jpg|450px]] | ||
| + | |||
| + | Now it looks better, but still have two problems: | ||
| + | |||
| + | 1. 0.25A is too large for the LED, we need to adjust it; | ||
| + | 2. The analogue reading in the air and in DI water is not 0, we need to try to change some settings to make it perfect. | ||
| + | |||
| + | We need to repeat the test later to see if this configuration can get the same result, and we also need to adjust the configurations to optimize the performance. | ||
| + | |||
| + | To be continued…… | ||
| + | |||
| + | == 24 February 2020 == | ||
| + | |||
| + | For our turbidity sensor, today we have done two things: | ||
| + | |||
| + | ==== Repeat the previous flat case experiment ==== | ||
| + | |||
| + | We used the same configuration of the flat case experiment last week, 0.25A current, 2M ohm resistor on the collector, and the 1.5mm coverage. Today we record 10 analogue reading numbers for each solution and used the average number to plot the diagram. | ||
| + | |||
| + | This time, the trend is similar to the results last week, but the numbers are different. Today the reading numbers are smaller than those we recorded last week, but still form a linear relationship. We need to keep repeating the experiment every day to see if it can still get the same results. Today's results are shown below: | ||
| + | |||
| + | [[File:1st repeat flat 0224.jpg|450px]] | ||
| + | |||
| + | ==== Change the distance between the two holes ==== | ||
| + | |||
| + | As the 0.25A current is too large for the LED and this also consumes too much power, we want to change it to low current, but it will affect the analogue reading numbers, so we tested the new case with a closer distance between two holes. The distance between two holes is 14mm now. Firstly, we still use the 0.25A current and see how the reading numbers change, with this configuration, the analogue reading number increased for each solution. The results can be seen in the following diagram: | ||
| + | |||
| + | [[File:Flat case 14 C-C.jpg|450px]] | ||
| + | |||
| + | With these results, we still used the 14mm case but changed the current to 0.1A, the reading number for DI water changed to 28, but the analogue reading in 240NTU solution changed to 93, that number is too small, so the next step we try to change the resistor on the collector, or make the distance between two holes closer. | ||
| + | |||
| + | Another thing is that the PT can get better performance at the solution below 300NTU, we are thinking to use a photodiode in our sensor as well. | ||
| + | |||
| + | To be continued…… | ||
| + | |||
| + | |||
| + | == 27 February 2020 == | ||
| + | |||
| + | Too busy these days, new update for our turbidity sensor. | ||
| + | |||
| + | Today we did several things: | ||
| + | |||
| + | ==== Repeat the circular case turbidity sensor experiment ==== | ||
| + | |||
| + | Today we repeated the circular sensor experiment, we did not change any configuration, all the settings are as same as before: 0.13A current for the LED, 4M ohm resistor on the base, 2M ohm resistor on the collector, we also take 10 analogue readings for each solution and calculate the average number of the analogue reading for plotting. | ||
| + | |||
| + | Today's results are higher than the previous results, and the points did not fit a linear relationship perfectly, R square for the points is 0.987, the results and diagram are shown below. | ||
| + | |||
| + | {| class="wikitable" | ||
| + | |- | ||
| + | | Turbidity(NTU) || 1(DI water)|| 46.8 || 76.5 || 178 || 479 | ||
| + | |- | ||
| + | | Analogue Reading || 1017 || 1007 || 984 || 743 || 47 | ||
| + | |} | ||
| + | |||
| + | [[File:4th repeat circular.png|450px]] | ||
| + | |||
| + | we have checked all the connections and the circuit, there is no difference with the previous configuration, the difference may be caused by the unstable power supply of the LED, as the current of the LED can be measured by the multimeter, the current changed slightly during the experiment, that may be the reason of the difference. | ||
| + | |||
| + | ==== Repeat the flat case turbidity sensor ==== | ||
| + | |||
| + | We use the flat case with 19mm distance between two holes, also we connect 2M ohm resistor on the collector, the current for the LED is 0.25A, the thickness of the coverage is 1.5mm, we used the glue gun to glue it on the surface of the case. Similarly, we recorded ten readings numbers and calculate the average. This time, the results are similar to the results in the previous experiment. The diagram below shows the results: | ||
| + | |||
| + | [[File:2nd flat repeat.png|450px]] | ||
| + | |||
| + | |||
| + | ==== test the different hole distance case ==== | ||
| + | |||
| + | As 0.25A is too large for the LED and it also consumes too much energy, we need to change the current lower, now we use 0.1A current for the LED, and then make the two holes closer. Today we used 0.1A current for our LED and tested four different cases, the distance between the two holes of the four cases are 19mm, 14mm,12mm and 10mm respectively. Each case we tested different solution, and then compare their performance, and also see which one is the best for our sensor. | ||
| + | |||
| + | The results are shown in the following diagram: | ||
| + | |||
| + | [[File:Different distance case test en.png|800px]] | ||
| + | |||
| + | From the diagram it can be seen that the results of all the cases followed a linear relationship, the closer the distance, the wider the range is. For example, for the 10mm distance case, the largest number is 744 for 1010NTU, and the smallest number is 68 for DI water, the 12mm distance performs similar to the 10mm distance case. The wider range works better for our monitoring. Next time, we can try to use 10mm case for further test. | ||
| + | |||
| + | |||
| + | ==== Validate the middle barrier test ==== | ||
| + | |||
| + | Last time we thought that it should be useful to add a barrier in the middle of the epoxy board, because the light may transmit by the epoxy board and affect the analogue reading. These days we were using two small pieces of epoxy board to cover the LED and the PT respectively, and use the glue gun to make a barrier in the middle. Today we did a test to validate the function of the middle barrier. | ||
| + | |||
| + | We use two 19mm distance flat case, one with a middle barrier, another one uses an entire epoxy board to cover the LED and the PT(without barrier), then tested them in different solution, compare the analogue readings. | ||
| + | |||
| + | The results are shown below: | ||
| + | |||
| + | {| class="wikitable" | ||
| + | |- | ||
| + | | Turbidity(NTU) || 1010 || 479 || 240 || 178 || 76.5 || 46.8 || 1 | ||
| + | |- | ||
| + | | without middle barrier ||467 || 280 || 170 || 152 || 75 || 57 || 39 | ||
| + | |- | ||
| + | | with barrier || 396 ||262 || 162 || 132 || 72 || 53 || 29 | ||
| + | |} | ||
| + | |||
| + | From the results, the reading numbers for the case with barrier are smaller than that without middle barrier, although not too much difference but make sense. That may caused by the long distance between the two holes, 19mm distance is a little bit far for the LED and the PT, light could not transmit easily with this distance. However, this experiment shows that it is useful to add a barrier in the middle to prevent light transmitting through the transparent board. | ||
| + | |||
| + | Next step work: | ||
| + | |||
| + | 1. Use 10mm distance case for further tests, change the resistors to make the reading number better; | ||
| + | |||
| + | 2. Calibration for the sensor to see which range turbidity is best for the PT's performance; | ||
| + | |||
| + | 3. Prepare the experiment for the photodiode(depends on the results of calibration). | ||
| + | |||
| + | To be continued…… | ||
| + | |||
| + | |||
| + | == 2nd March 2020 == | ||
| + | |||
| + | ==== Repeat the circular case test ==== | ||
| + | |||
| + | Today we did the 5th repeat test of the circular turbidity sensor. This test roughly fit a linear relationship, but not as perfect as the previous experiment. The five times result can be seen in the following diagrams: | ||
| + | |||
| + | [[File:Circular 1st repeat.png|450px]] | ||
| + | [[File:Circular 2nd repeat.png|450px]] | ||
| + | [[File:Circular 3rd repeat.png|450px]] | ||
| + | [[File:Circular 4th repeat.png|450px]] | ||
| + | [[File:Circular 5th repeat.png|450px]] | ||
| + | |||
| + | From the diagrams above, we can see the reading numbers are stable, but still have uncertainty. | ||
| + | |||
| + | ==== Repeat the flat surface case with 19mm distance experiment ==== | ||
| + | |||
| + | We used the 19mm distance flat case for testing, today's test is the 3rd time test, the test is similar to the circular test, the results of the three test are shown below. | ||
| + | |||
| + | [[File:19 flat 1st repeat.png|450px]] | ||
| + | [[File:19 flat 2nd repeat.png|450px]] | ||
| + | [[File:19 flat 3rd repeat.png|450px]] | ||
| + | |||
| + | It also has problems, for this case, the linear relationship only fit the turbidity solution between 0 to 250NTU, if we plot the curve including 480NTU result, the points do not fit a good linear line. The diagrams are shown below. | ||
| + | |||
| + | [[File:19 flat 1st repeat non.png|450px]] | ||
| + | [[File:19 flat 2nd repeat non.png|450px]] | ||
| + | [[File:19 flat 3rd repeat non.png|450px]] | ||
| + | |||
| + | ==== Test 12mm distance flat surface case ==== | ||
| + | |||
| + | As we tested last time, the 12mm distance flat case and the 10mm distance flat case have a wider range of results, as the 10mm distance is too close, we used 12mm distance case for testing. The test we did today recorded ten reading numbers for each solution, and use the average to plot the curve. | ||
| + | |||
| + | The readings from 0 to 479NTU solution fit a perfect linear relationship(R square is 0.9981), if we plot the 1010NTU result on the curve, the curve did not fit the linear relationship perfectly, R square is 0.9889, still not bad. | ||
| + | The following diagram shows the result: | ||
| + | |||
| + | [[File:12mm flat test 1st.png|450px]] | ||
| + | [[File:12mm flat test 1st non.png|450px]] | ||
| + | |||
| + | |||
| + | == 3rd March 2020== | ||
| + | |||
| + | Today we repeated the 12mm distance flat surface test. | ||
| + | |||
| + | Previously, we use the glue gun to form the middle barrier of the case, now we found the light may transmit throuth the glue gun material, so we change the middle barrier. Now we used the epoxy to glue the two pieces of epoxy cover on the case, and glue a piece of blue tack in the middle and then test the sensor. The following diagram shows the result: | ||
| + | |||
| + | [[File:12 flat 1st repeat.png|450px]] | ||
| + | [[File:12 flat 1st repeat non.png|450px]] | ||
| + | |||
| + | Both of the reuslts form not bad linear relationship, but still have uncertainty, next step we need do two things: | ||
| + | 1. repeat the test again and again to get as more results as possible, and then determine the uncertainty; | ||
| + | 2. use a regulator to make the input voltage constant and then do the test. | ||
| + | |||
| + | To be continued…… | ||
| + | |||
| + | == 4th March 2020 == | ||
| + | |||
| + | Today, we tested the middle barrier test again. Previously, we use the case which is 19mm distance between two holes, we thought it is too far away for the light to transmit, so we are not sure if the middle barrier can be used or not. Today we used the 12mm distance case for the test, one with middle barrier which is blue tack, and another one is a whole epoxy board on the surface, the two testing case can be seen in the following picture. | ||
| + | |||
| + | |||
| + | [[File:Middle barrier test 12mm.jpg|600px]] | ||
| + | |||
| + | In this test, we tested the middle barrier case for two times, and tested the case without middle barrier once, each test we recorded 10 analogue reading numbers and used the average value for plotting. All the results showed a not bad linear relationship, especially for 0-500NTU turbidity solution. The results and diagrams are shown below. | ||
| + | |||
| + | '''The experiment results can be seen in the table below:''' | ||
| + | |||
| + | {| class="wikitable" | ||
| + | |- | ||
| + | | Item || 1010NTU || 479NTU || 240NTU || 165NTU || 76.5NTU || 46.8NTU || 1NTU(DI water) | ||
| + | |- | ||
| + | | case without middle barrier || 839.8 || 432.3 || 268.6 || 203.4 || 107.5 || 75.9 || 32.5 | ||
| + | |- | ||
| + | | case with middle barrier 1st time || 620.9 || 365.5 || 212.1 || 161.6 || 84.3 || 57 || 35.5 | ||
| + | |- | ||
| + | | case with middle barrier 2nd time || 619.8 || 368.2 || 213.3 || 167.6 || 86 || 57.6 || 32.3 | ||
| + | |} | ||
| + | |||
| + | |||
| + | We can also see the plotting diagram: | ||
| + | |||
| + | [[File:Middle barrier test 12 1-500NTU.png|650px]] [[File:Middle barrier test 12 1-1010NTU.png|650px]] | ||
| + | |||
| + | From the results, it can be seen that the analogue range for without middle barrier case is larger than the other one, and the results also form a linear relationship, so the case without middle barrier works better. | ||
| + | |||
| + | In the following experiment, we will try to use the case without the middle barrier for further testing. | ||
| + | |||
| + | |||
| + | == 12th March 2020 == | ||
| + | |||
| + | In the past week, we used the flat case with a whole epoxy board to repeat the test. We want to know the uncertainty of the sensor. So we want to repeat the test several times, if the data is enough, we can use them to determine the relationship of the analogue reading and the turbidity, and also the uncertainty of the sensor. | ||
| + | |||
| + | For the configuration of the test: | ||
| + | The distance between the two holes: 12mm | ||
| + | The thickness of the epoxy board: 1.5mm | ||
| + | Collector: 2M ohm resistor | ||
| + | LED: 1.56v voltage and 0.1A current | ||
| + | |||
| + | Until now, we have repeated 21 tests. The results can be seen in the following table: | ||
| + | |||
| + | [[File:Repeat test results 2.png|500px]] | ||
| + | |||
| + | From the table, we can see that the R square is not bad, but the slope and the intercept varies a lot. We thought it is still the problem of the external power supplier of the LED. When we tested the sensor, the current of the LED always changes, we have to manually change the voltage to make the LED current 0.1A, but it still not stable enough. Sometimes the unstable voltage will affect the performance of the LED. We need to use a regulator to make the voltage constant. | ||
| + | |||
| + | When the LED has 0.1A current, the voltage for the DC power is 1.55V. So next step we will buy a 1.55 voltage regulator to make the voltage constant and stable, and then repeat our test. | ||
| + | |||
| + | == 14th March 2020== | ||
| + | |||
| + | We got the 1.55v voltage regulator. And when we use the regulator in our circuit, the output voltage of the regulator is constantly 1.54V. The circuit of the LED can be seen as follows: | ||
| + | |||
| + | [[File:Circuit regulator 1.png|800px]] | ||
| + | |||
| + | But when we test the circuit, the current of LED is only 0.07A, the voltage drop of the circuit is 1.4v not 1.54v. We think it may be the problem of the relay, so we did not connect the relay in the circuit, just connect the LED in the circuit, now the circuit is like the following diagram. | ||
| + | |||
| + | [[File:Circuit regulator no relay 2.png|700px]] | ||
| + | |||
| + | With this circuit, the voltage drop of the LED is also 1.4v, so the current of the LED is not 0.1A. | ||
| + | |||
| + | But the LED still works, as the voltage decrease, the analogue reading number became smaller, which means it still forms a kind of relationship, but the range of the analogue reading is narrow. For example, the analogue reading number of 1000NTU turbidity solution is around 660 but now it is only more than 420. | ||
| + | |||
| + | We are waiting for our new regulator to come, and before that, we will use this one for testing, and see what kind of relationship will it form. | ||
| + | |||
| + | |||
| + | == 16th March 2020 == | ||
| + | |||
| + | We start to test the sensor, today we did not use realy in the LED circuit, we keep the LED on, and the current of the LED is 0.07A. Each time after the test, we used the turbidity meter to test the turbidity of the solution in the solution to make the experiment more accurate. After 6 tests, the results can be seen as the table below: | ||
| + | |||
| + | [[File:Repeat test without relay results1.png|600px]] | ||
| + | |||
| + | These results are not bad, as the voltage regulator can output the constant voltage, the slop and the intersection of the line has less vibration. However, in the field, we still want to make the LED work intermittently, so next step, we will add the relay in our circuit and repeat the test. | ||
| + | |||
| + | |||
| + | == 17th March 2020 == | ||
| + | |||
| + | Today we used the relay in our LED circuit, and other things did not change. We have done 6 tests today, the results can be seen as follows: | ||
| + | |||
| + | [[File:Repeat test with relay results1.png|600px]] | ||
| + | |||
| + | Now the results are not bad, when the new regulator comes, we can use 0.1A to test the performance, if it still works well, we can use the regulator for our design. | ||
| + | |||
| + | The next step, we have several things to do: | ||
| + | 1. Use our BoSL board for further testing; | ||
| + | 2. Get motor work for wiper; | ||
| + | 3. Design the PCB for the sensor. | ||
| + | |||
| + | |||
| + | == 18th March 2020== | ||
| + | |||
| + | After fieldwork today, we repeated two times of the experiment in the afternoon, the results can be seen as follows: | ||
| + | |||
| + | [[File:Repeat test results 0318.png|600px]] | ||
| + | |||
| + | == 19th March 2020== | ||
| + | |||
| + | Today, we change a little bit of the LED circuit, we put the relay just before the LED and then still repeat the test for 14 times, now we have already repeated the test for 20 times. The summary results can be seen in the following diagram: | ||
| + | |||
| + | [[File:Repeat test results 0319 summary.png|600px]] | ||
| + | |||
| + | It can be seen that the slop is slightly different from the test before we change the relay. I think the problem does not come from changing the circuit, but from the connection of the breadboard. Although the result is different, there is no large vibration which is good. The next step I think we need to do is design the circuit and PCB board, and wait for the new regulator comes and do more tests. | ||
| + | |||
| + | == 24th March 2020== | ||
| + | |||
| + | Today we designed the circuit of the board, we use the ATmega328P-AU as our controller, the circuit diagram can be seen as the following diagram, it has already been sent to Stephen for double-check, once it is confirmed, we can process to test it. Next step we need to design the case of the sensor with the motor. | ||
| + | |||
| + | [[File:Circuit diagram.png|600px]] | ||
| + | |||
| + | ==26th March 2020 == | ||
| + | |||
| + | Today we did several things: | ||
| + | |||
| + | ==== Test the breadboard Arduino==== | ||
| + | |||
| + | Now we have already set up a breadboard Arduino, base on this test, we are sure that the chip can be used on the PCB to control the turbidity sensor. This time, we did not upload the turbidity sensor code on the board, for testing purpose, we only use a simple blink code to make a LED blink. As it works successfully, we can use a similar thing later for testing. | ||
| + | |||
| + | [[File:Breadboard Arduino.jpg|400px]] | ||
| + | |||
| + | Next step, we will only use this chip to control the turbidity sensor and see if the results will be the same. | ||
| + | |||
| + | ==== Test the BosL board turbidity sensor ==== | ||
| + | |||
| + | We connect the turbidity sensor on our BoSL board, just like the circuit diagram above, we use two digital pins and "HIGH" and "LOW" code to control on and off of the LED and the phototransistor, but we got the problem, as the digital pin of Arduino can output maximum 20mA current, however the current we need for our LED is 100mA, so this connection is not able to support the turbidity. | ||
| + | |||
| + | To ensure we still control on and off of the turbidity sensor, we need to change our design, the power of the LED circuit will be provided by 3.3v directly, but we need to use an NPN transistor to work as a switch, and then use the digital pin to control the whole circuit. | ||
| + | |||
| + | ==== Change the design of the circuit ==== | ||
| + | |||
| + | Due to the issue we talked above, we have to change our circuit, not only the LED diagram, but also the crystal, now we change the 16Mhz crystal to 8Mhz crystal. We also add some pins on the board. | ||
| + | |||
| + | [[File:Circuit diagram new.png|600px]] | ||
| + | |||
| + | ==27th March 2020== | ||
| + | |||
| + | ==== Test on BoSL board==== | ||
| + | |||
| + | Today we assembled all the parts on the BoSL board, as the circuit we used above, we used the NPN transistor to control the LED circuit, the circuit is connect directly to the 3.3v pin. Therefore, in this circuit, the LED and the phototransistor are all supplied by 3.3v. | ||
| + | |||
| + | The NPN transistor worked successfully, we can use "HIGH" and "LOW" code to control on and off of all the circuit. So in the following design, we can add NPN transistors for the final design. | ||
| + | |||
| + | We also tested the analogue reading, when we set the sensor in dark environment in air, the analogue reading is about 25, and in DI water, the analogue reading is around 6, to make the sensor face the table, the analogue reading number is supposed as the largest number which is more than 920, that results are not bad. We need to test them in more calibrated turbidity solution later. | ||
| + | |||
| + | ==== Modify the circuit diagram ==== | ||
| + | |||
| + | The circuit diagram is finalised, we have changed some parts of the diagram, also we set some pins for the motor and set NPN transistor to control that, a pull-up resistor is added for the reset button. | ||
| + | |||
| + | [[File:Final circuit diagram v1.png|600px]] | ||
| + | |||
| + | == 4th April 2020== | ||
| + | |||
| + | After we designed the circuit diagram, we need to combine all the things on a PCB, so we need to design a PCB. | ||
| + | |||
| + | ==== Change the circuit diagram ==== | ||
| + | |||
| + | As we want to make the PCB as small as possible, so we need to make sure all the route goes wisely, and if so we changed the circuit diagram. However, we did not change any parts of the circuit, only change the pin connections to make the parts can easily connect to the ATmega microcontroller. The new circuit diagram can be seen as follows: | ||
| + | |||
| + | [[File:Final circuit diagram v1.1.png|600px]] | ||
| + | |||
| + | ==== Design PCB ==== | ||
| + | |||
| + | As we changed the circuit diagram, we can design the PCB. The dimension of our PCB is about 24mm*12mm which is a double-sided board, the distance between the LED and the phototransistor is 12mm. As we only need emitter and collector pin of the phototransistor, we deleted the base footprint of the PT. The PCB designed diagram can be seen as follows. | ||
| + | |||
| + | [[File:Final PCB footprint front v1.1.png|500px]] [[File:Final PCB footprint back v1.1.png|600px]] | ||
| + | |||
| + | This design will send to our PCB supplier to print. | ||
| + | |||
| + | == 5th May 2020 == | ||
| + | |||
| + | After one month, finally, we got our turbidity PCB, the tiny PCB dimension is 24mm*12mm, the following picture shows the real turbidity PCB. | ||
| + | |||
| + | [[File:PCB real 1.jpg|200px]] [[File:PCB real 2.jpg|250px]] | ||
| + | [[File:PCB real 3.jpg|250px]] [[File:PCB real 4.jpg|250px]] | ||
| + | |||
| + | == 9th May 2020 == | ||
| + | |||
| + | In the past days, we tested the PCB, as we need to make the testing simple, we did not solder the LED and the PT on the board, instead we solar some pins on the board, and then connected the previous LED and PT to the PCB, and use the previous case to test the analogue reading. | ||
| + | |||
| + | When we put a barrier in front of the case surface, the analogue reading is 1023, which is the largest value. When we put the sensor in air(not in black box), the analogue reading is 55-70, that is a reasonable result which shows the PCB works well. The next step, we need to use place the PCB and the sensor in a proper case and test the analogue reading in solution. | ||
| + | |||
| + | Please wait for the new testing results. | ||
| + | |||
| + | To be continued...... | ||
| + | |||
| + | == 14th May 2020 == | ||
| + | |||
| + | Some new updates for the turbidity PCB testing. The whole process is a little bit complicated. | ||
| + | |||
| + | Now we want to use the ethernet cable to connect the PCB, so I desolder the pins on the PCB and connect the Ethernet wires on the holes: TX, RX, restart, GND and 3.3V. It's a little bit hard to desolder the pins and solder the wires into the holes, and after doing that, we uploaded the program into the PCB, it is a very simple code to let the PCB scan 1s and turn off the LED and PT for 1s. So, on the serial monitor, we can see the analogue reading updates every 2 seconds. Even we did not plug the LED and the PT, there will be new analogue reading which is 0. it can be seen as the following diagram; | ||
| + | |||
| + | [[File:Analogue reading good.png|600px]] | ||
| + | |||
| + | Before I soldered the LED and the PT on the board, I used the previous LED and PT(soldering on the wires) to test, it works well. Then I put all the parts on the board and solder them on, but after that, the analogy reading got problems. The serial monitor looks like this: | ||
| + | |||
| + | [[File:Analogue reading bad.png|600px]] | ||
| + | |||
| + | You can see the last line, the PCB stop working. I think it must be some problems when I desolder the pins, maybe the solder point affects the PCB routes, so I took a new PCB and solder all the wires on the pins, I did not desolder anything, it looks like this: | ||
| + | |||
| + | [[File:Solder on pins.png|300px]] | ||
| + | |||
| + | And after that, I also tested using the LED and PT(soldering on wires), they all work. Before solder the PT and LED on the PCB, I plug the PT on the holes, the analogue reading changes to 30-40, because it will detect the environmental light. But when I plug the LED on the board, the same problem occurred. There must be something wrong with the LED. | ||
| + | |||
| + | Now I have to test the performance of the LED. I connected the LED on the female-male jumper wire, and simply plug the jumper wire pins in the holes, it works, but when I connect the LED two legs on the hole, it stops working. | ||
| + | And when I put the LED to the end on the PCB, it works, it looks like the following thing: | ||
| + | |||
| + | [[File:LED to the end.png|400px]] | ||
| + | |||
| + | We thought it maybe because of the wires are not insulating, so we need to put heat shrink on the wires, after that, all the wires got heat shrink, the problem still there. We tried many times to change the position of the two LED legs, and we are sure that the two legs did not touch each other, but it still has the problem. | ||
| + | |||
| + | At last, we just use two jumper wires(without any pins) to connect the LED and the holes, and this method works. And when we shot the two jumper wires, it the same problem occurred. | ||
| + | |||
| + | So we thought there must be some problems with the two legs of LED and the PCB, and something internal made the LED short the whole circuit on the PCB. But we haven't find the problem. | ||
| + | |||
| + | Now we are thinking to just try to connect the jumper wires on the LED and PCB instead of directly connecting the two legs on the PCB. | ||
| + | |||
| + | To be continued........ | ||
| + | |||
| + | == 16th May 2020 == | ||
| + | |||
| + | During the past two days, we tested the sensors for many times, the results showed that when we connected the LED legs to the PCB holes, the whole PCB stopped working. And the weird thing is LED soldered on the jumper wires can work on the PCB. | ||
| + | |||
| + | We are thinking that maybe the problem is because too much current passing through the LED when the LED legs touch the PCB. So we use another Arduino UNO to supply the power of the board. We connected 3.3v on the UNO board, and other pins(TX, RX, RESET, GND) still connecting to the BoSL board, also we connected the GND of UNO and BoSL boards to make they have the same GND. | ||
| + | |||
| + | After that, we put LED in the PCB holes, it was working. | ||
| + | |||
| + | That means our hypothesis is right, the LED needs too much current and lets the BoSL board stop working. So we need to change the current of the LED. We tried to connect some resistor on the LED to see if it works. When we connected 100ohm resistor, it worked. And we need to try more smaller resistors to see which is the minimum value to keep the PCB working. From 100ohm to 1ohm, even 1ohm resistor can make the PCB working. But when we tried to use a 0ohm resistor, it did not work. So still the problem, why jumper wire work but 0ohm resistor did not work. We used the multimeter to measure the resistance of the jumper wire, we found the resistance of the jumper wire is 0.1ohm. So that means, the LED needs some resistance connecting to the holes, we cannot connect it directly to the PCB. | ||
| + | |||
| + | So we just solder a 1ohm resistor on the LED, and then solder it on the PCB. It can be seen like this: | ||
| + | |||
| + | [[File:Resistor soldered sensor.png|400px]] | ||
| + | |||
| + | And it was working. | ||
| + | |||
| + | Then we equip them in the case and did a quick testing, the sensor and results can be seen as following: | ||
| + | |||
| + | [[File:PCB sensor in case.png|400px]] [[File:PCB first test.png|600px]] | ||
| + | |||
| + | As R square is 0.9982 which is not bad, this PCB works well. | ||
| + | |||
| + | The following steps we need to do are: | ||
| + | 1. redesign the sensor case, as we solder the resistor on the LED, so the current case is not big enough; | ||
| + | |||
| + | 2. to make the sensor waterproof and the PCB is fixed in the case; | ||
| + | |||
| + | 3. repeat the test in three different sensors to see the performance; | ||
| + | |||
| + | 4. redesign the PCB, add a resistor on the LED route. | ||
| + | |||
| + | To be continued...... | ||
| + | |||
| + | == 18th May 2020 == | ||
| + | |||
| + | Yesterday and today, we printed two new sensor cases and made two sensors, and then tested them in the real Turbidity solution. | ||
| + | |||
| + | ==== Sensors Making ==== | ||
| + | |||
| + | We designed two new sensor boxes, the new design allows the screws can be fixed inside the case. The new case and the lid can be seen like this: | ||
| + | |||
| + | [[File:Case v2 1.jpg|250px]] [[File:Case v2 2.jpg|250px]] | ||
| + | |||
| + | Then we can place the sensor(PCB soldering LED and PT) in the case, and then seal the whole sensor in the case. There are two steps: 1. after placing the LED and the PT in the two holes, we inject some expoy into the case to make sure the LED and PT are fixed in the case; 2. after the epoxy became solid, we use a syringe to inject some silicone in the case(on the top of the epoxy) to make the whole sensor waterproof. We also need to ensure the wires are all in the silicone so that water won't goes inside the cable. | ||
| + | |||
| + | [[File:Case v2 3.jpg|300px|File:Case v2 3.jpg]] [[File:Case v2 4.jpg|280px|File:Case v2 4.jpg]] [[File:Case v2 5.jpg|300px|File:Case v2 5.jpg]] | ||
| + | |||
| + | After about 30 mins, when the silicone becomes sticky, we need to put the lid on the case, and also use the glue gun to seal the lid and also glue a cove on the surface of the case. We also use a M8 cable gland on the back lid to make sure the cable does not move at all. | ||
| + | |||
| + | [[File:Case v2 6.jpg|300px]] [[File:Case v2 7.jpg|300px]] | ||
| + | |||
| + | |||
| + | This design still has some drawbacks, we need to do some enhancement in the current design. | ||
| + | |||
| + | ==== Test the sensor==== | ||
| + | |||
| + | Now we got two sensors, use the same method to test the performance of the two sensors. | ||
| + | |||
| + | The two sensors' results can be seen as follows: | ||
| + | |||
| + | [[File:New sensor test results 2nd.png|500px]] | ||
| + | |||
| + | The results of the two sensors are almost the same, however the results still have differences with the previous ones, maybe because we change the case. | ||
| + | |||
| + | We need to do more test for the two sensors to make sure they work well. | ||
| + | |||
| + | == 26 May 2020 Sensor Installation== | ||
| + | |||
| + | Today we have installed the two turbidity sensors in Troups Creek Wetland, one at the inlet and another at the weir near the outlet. We also installed two greenspan turbidity sensor in the same position to compare the results. | ||
| + | |||
| + | ==== Inlet installation ==== | ||
| + | |||
| + | The inlet low-cost sensor was installed by fixing it on a piece of rectangular hollow section steel, and then fixed the steel on the sidewall. The low-cost sensor is facing the downstream of the water flow to protect the surface of the sensor. The BoSL board is put in a metal box and use a chain to fix on the sidewall to make it easy for maintenance. The data is transmitted to the website every 6 mins. | ||
| + | |||
| + | The Greenspan sensor is put in a piece of PVC pipe, and the pipe is fixed on the bottom of the creek, the Greenspan sensor is also facing the downstream of the water flow. The data is collected and saved in the data logger, the datalogger is in a cabinet on the bank, the cable of the Greenspan sensor is fixed and protected on the bed of the creek. | ||
| + | |||
| + | The distance between the two sensors is less than 60cm. | ||
| + | |||
| + | [[File:Inlet sensor.png|400px|File:Inlet sensor.png]] | ||
| + | [[File:Inlet completion.png|400px|File:Inlet completion.png]] | ||
| + | |||
| + | ==== Outlet installation ==== | ||
| + | |||
| + | The Outlet Greenspan sensor is also fixed in a PVC pipe, and the pipe is fixed on the weir, the depth of the Greenspan sensor is about 20cm. The low-cost sensor is fixing on the pipe, both the BoSL board and the data logger is stored in the outlet cabinet. Same as the inlet sensor, the low-cost sensor will upload data each 6 mins. | ||
| + | |||
| + | == 1 June 2020 == | ||
| + | |||
| + | ==== Sensor data on installation day==== | ||
| + | |||
| + | After we installing the sensors, we checked the sensor value, in the afternoon, the inlet value is about 600, which means the turbidity should be around 550NTU, and the outlet value is about 1010 in the afternoon, which indicating the turbidity is about 900NTU, but the Greenspan sensor value at the inlet and outlet is around 15NTU and 70NTU respectively. We thought that maybe because the sunlight will affect the analogue reading of the low-cost turbidity sensor. | ||
| + | |||
| + | ==== Data collection for the past three days==== | ||
| + | As we have monitored the turbidity for more than three days, for our hypothesis, if the difference is caused by sunlight, the analogue reading value should be fine at night. We can see the following diagram for the data: | ||
| + | |||
| + | [[File:Inlet data 3 days.png|800px]] | ||
| + | [[File:Outlet data 3 days.png|800px]] | ||
| + | |||
| + | From the diagram, it can be seen that at night the analogue reading of the low-cost sensors are stable and much lower than the daytime readings, that proves our hypothesis is right. | ||
| + | |||
| + | So the following step we need to design and print a cover of the sensor to get rid of the effects from the sunlight. | ||
| + | |||
| + | To be continued...... | ||
| + | |||
| + | ==18th June 2020== | ||
| + | <br> | ||
| + | Watch the following video to find out all about our first field trial of the all new BoSL Turbidity Probe. We are very excited! | ||
| + | <br> | ||
| + | <embedvideo dimensions="900" service="youtube">https://www.youtube.com/watch?v=aue3M-QFxgY</embedvideo> | ||
| + | |||
| + | |||
| + | ==19th June 2020== | ||
| + | |||
| + | As the video shows, now we are facing the problem of sunlight impact and the biofilm, now we are trying to fix both of the problems. | ||
| + | |||
| + | ==== Cover design and installation for the sensor ==== | ||
| + | |||
| + | As mentioned in the video, now we have designed a new sensor cover on the sensor case to get rid of the sunlight, water will go through the case via its flowing direction, however, sunlight cannot penetrate into the case to affect the results. The sensor case is showing below: | ||
| + | |||
| + | [[File:Sensor cover.png|300px]] | ||
| + | |||
| + | With the help of this case, only a little sunlight can be detected by the phototransistor, we also changed the code to get the analogue reading for two times, one with LED and another one without LED, so we can get the background light by measuring the analogue reading without LED on, and then we can get the difference between the reading with LED and without LED, so the difference can be used for the turbidity analysis. | ||
| + | |||
| + | ==== Calibration in the field ==== | ||
| + | |||
| + | We also did the calibration in the field for both sensors, as the environment in the field and in the lab is different, so we need to do the calibration before cleaning the biofilm and after the biofilm. We have done the calibration for two times, the first time we did the calibration by turbidity solution between 50NTU to 450NTU, and the second calibration we used 3NTU TO 40NTU turbidity solution, and then we use the calibration curve to apply to the raw data, then do the comparison. | ||
| + | |||
| + | For the calibration method, we use a calibrated turbidity meter as a standard, use different solution to take the results from both Green Span sensor and the Low-cost sensor, at last, take the standard result from the turbidity meter. | ||
| + | |||
| + | |||
| + | == 21st June 2020 Data Comparison == | ||
| + | |||
| + | After we calibrated the two sensors in the field, we applied the calibration equation to the two sensors' raw data, the comparison of the two sensors is shown in the following diagram: | ||
| + | |||
| + | The first comparison is from the cover installation day to the first calibration day, it can be seen after the calibration, the largest difference between the two sensors is 5 NTU, which is not bad; | ||
| + | |||
| + | [[File:Data comparison 1.png|800px]] | ||
| + | |||
| + | For the data comparison between the first field calibration and the second field calibration, the correlation between the two sensors is much better, the two sensors' results are very similar which can be seen below: | ||
| + | |||
| + | [[File:Data comparison 2.png|800px]] | ||
| + | |||
| + | So our method for the calibration is available for further comparison, we may do this calibrated work in the future. | ||
| + | |||
| + | |||
| + | == 28th June 2020 second Data Comparison == | ||
| + | |||
| + | We collect the data in the past week for comparison, so the calibration equation we used for the two sensors is not simply using the trendline, we use the trendline to set the intersection of the two sensors, and use the turbidity meter data and the two sensor data difference, set the minimum value to solve the slope, and use the slope and the intersection to form a calibration linear curve. As each time we need to do the calibration for both before cleaning and after cleaning, the curve is different before and after cleaning. We may use last time after cleaning curve and this time before cleaning curve for the past one week's data calibration. As they are different, we use a linear relationship to indicate the changing and then determine the corresponding parameter for each single logging time, and plot the curve for the calibration. By using this method, we can get the following comparison diagram: | ||
| + | |||
| + | [[File:Data comparison 3.png|800px]] | ||
| + | |||
| + | Currently, we still get some differences between the two sensors, will do some further monitoring and calibration to make sure we can get more accurate results. | ||
| + | |||
| + | |||
| + | |||
| + | == 8th July 2020 Third Data Comparison == | ||
| + | |||
| + | We collected the monitoring data after 10 days from the last maintenance, from the Melbourne water rainfall data, there were slight rainfall events(0.2mm-0.4mm) on 28th and 30th, the low-cost sensor did not have too much change on these days, the Green Span sensor had big variations on 4th of July, but there are also more NAN values on the rainfall days, our hypothesis is the big variations are caused by the algae. | ||
| + | Troups Creek area had a big rainfall event on 4th of July, it can be seen obviously seen that the turbidity value has increased on that day, and the changing pattern for both sensors are similar. From 6th of July, the low-cost sensor started to have big variations, that may be caused by the biofilm on the surface, as we mentioned before, the regular maintenance period is 7 days, so after one week from the last maintenance, the variation is big. | ||
| + | |||
| + | The data comparison can be seen in the following diagram: | ||
| + | |||
| + | [[File:Data comparison 4.png|800px]] | ||
| + | |||
| + | == 15th July 2020 Fourth Data Comparison == | ||
| + | |||
| + | We did the weekly calibration as usual, it was 7 days since the last calibration, and from the data this time, we did not see too much big variation for both of the sensors, the data of the two sensors are close to each other. The data comparison of this calibration can be seen as the following diagram: | ||
| + | |||
| + | |||
| + | [[File:Data comparison 5.png|800px]] | ||
| + | |||
| + | == 24th July 2020 == | ||
| + | |||
| + | We will introduce some exciting things today! | ||
| + | |||
| + | ==== Data collection and sensor calibration ==== | ||
| + | |||
| + | We did the sensor calibration at the Inlet as usual. As we are busy preparing the new sensors this week, so the calibration is two days later than one week. Unfortunately, when we arrived at the site, we found the Green Span sensor battery is disconnected, and we connected the wires, only 8 data can be collected, that means the battery disconnected shortly after we left, so we missed the one week Green Span data, and this week we cannot do the normal data comparison, we will make the comparison happen next week. | ||
| + | |||
| + | ==== New sensor installation ==== | ||
| + | |||
| + | This is the most exciting thing in the past week! We installed ten more sensors in the Troups Creek wetland. | ||
| + | |||
| + | The installation method is easy. First, we prepare all the sensors in the lab, we put our BoSL board in a small box which is perfectly fit the BoSL board and battery, the box will be fixed on one end of a 1.5m PVC pipe. Then we use our 3D printer to print a sensor holder and fix the turbidity sensor and All-in-one sensor on the PVC pipe, the location of the sensors are 30cm away from another end. The final thing we need to do is punch a star picket in the wetland and then slide down the PVC pipe on the star picket. Then we can see a pipe stand in the wetland with a small box on the top, it is a sensor which can monitor '''turbidity, EC, water temperature, air temperature, water depth and air pressure''', the data of these parameters will be uploaded to the website every 6 mins. | ||
| + | |||
| + | In the lab, we prepared ten sensors and installed them today. The lab preparation can be seen as the following picture. | ||
| + | |||
| + | [[File:Lab sensor preparation.png|600px]] | ||
| + | |||
| + | After sorting out all the preparation work, we bring the ten sensors to the wetland and then simply punch the start picket and slide the sensors on them. All the sensors were installed in 2 hours. | ||
| + | |||
| + | The installation process can be seen as the following pictures. | ||
| + | |||
| + | [[File:Installation Dave Peter.jpg|600px]] [[File:Site 6 sensor.jpg|340px]] | ||
| + | |||
| + | |||
| + | Now we have ten sensors along the wetland, the position of the sensors can be seen as the following diagram, we also measured the GPS coordinate when we installed them. | ||
| + | |||
| + | [[File:Sensor location.png|600px]] [[File:GPS coordinate.png|500px]] | ||
| + | |||
| + | Now we can do long-term real-time monitoring in the wetland! The last picture for the bird, they have new standing points now! | ||
| + | |||
| + | [[File:Bird on sensor box.jpg|600px]] | ||
| + | |||
| + | == 29th July 2020 == | ||
| + | |||
| + | After we installed the sensors for 3 days, we found two of the sensors stopped logging, and before they stopped logging, the last logging data are all in normal, so the problem is not from the sensors, maybe the BoSL board got some problems, or simply battery dead. | ||
| + | |||
| + | We went to the wetland and checked the problematic sensors, we found the wire connections are good, and the batteries are both in good condition. However, in the early morning, we found a lot of small water drops inside the box, the water drops may come from the evaporation and condensation via the bottom hole. And we checked the data, the sensors stopped logging from early morning or later afternoon which is the right time for condensation. | ||
| + | |||
| + | [[File:Water drops in the box.png|400px]] | ||
| + | |||
| + | We clean up the water drops and reconnect the battery, the problematic sensor started to work again. Then we use some sponge and foam to seal most of the bottom hole, we hope this will make less water in the box. It is clear that sponge and foam are not good enough to solve the problem, however, we cannot use silicon to completely seal the hole, as we still need gap for the rope and cable to move, now we are looking for some suitable cable gland which may efficiently prevent water goes into the box. | ||
| + | |||
| + | [[File:Sponge in hole.png|400px]] | ||
| + | |||
| + | Also, as this kind of battery still needs a lot of work on connection, in the future, we may change another kind of battery which is more robust than the current ones, that will cause fewer problems. | ||
| + | |||
| + | == 1st August 2020 == | ||
| + | |||
| + | ==== Sensor Maintenance ==== | ||
| + | |||
| + | From the sensor installation last time, it was almost one week. As we need to do the turbidity sensor maintenance every week, now we came to the site to replace them. From now on, we won't do the sensor maintenance in the field, we may use another sensor to replace the old one, and take the old sensors to our lab for further calibration and maintenance. In order to make sure the biofilm won't dry during the sensor transportation, we may make the sensors stay in the water and then do the calibration before and after clean the surface. | ||
| + | |||
| + | Last time, we only installed ten sensors in the wetland, now we also changed the inlet and outlet sensors to the PVC pipe type, by using this method, we do not need to do the low-cost sensor calibration in the field, the only thing we need to do is the Green Span sensor calibration. | ||
| + | |||
| + | Now, there are 12 PVC pipe sensors along the wetland, as we changed the inlet sensor and outlet sensor to new ones, the distance between the new sensors and the Green Span senors are around 50cm. | ||
| + | |||
| + | ==== Velocity Sensor Installation ==== | ||
| + | |||
| + | To get more information from the wetland, we also installed the Low-cost velocity sensor along the wetland, three velocity sensors are installed in the wetland at site 8, site 5 and site 1 respectively. Then installation method is as same as the Turbidity sensor, using star picket and PCV pipe, the installed velocity is standing beside the turbidity sensor. There are two transducers on the velocity sensor surface which have to be facing the water flow. | ||
| + | |||
| + | [[File:Velocity sensor installation.png|400px]] [[File:Installed velocity sensor.png|365px]] | ||
| + | |||
| + | Now the sensor location can be seen as the following diagram(Blue points indicate the velocity sensor): | ||
| + | |||
| + | [[File:ALL sensor location.png|700px]] | ||
| + | |||
| + | ==== Data comparison ==== | ||
| + | |||
| + | After we did the calibration, we compared the data for both inlet and outlet monitoring. In the past week, no rainfall event happened at Troups catchment, so the turbidity data is more stable than before. | ||
| + | |||
| + | '''For Inlet comparison:''' | ||
| + | |||
| + | [[File:Calibration data comparison 6 Inlet.png|800px]] | ||
| + | |||
| + | '''And for Outlet comparison''' | ||
| + | |||
| + | [[File:Calibration data comparison 6 Onlet.png|800px]] | ||
| + | |||
| + | From the diagrams above, it is clear that for the outlet, the difference between the low-cost sensor and the Green Span sensor became larger over time, also there is a big jump for both sensors at the end of the monitoring period. The hypothesis for the large difference is the sediment problem, as more and more sediment will stay in the sensor cover, that sediment would make more reflection in the cover. At the end of the monitoring period, both sensors had a weird jump, we supposed that more biofilm was on the surface of the sensors, and that will significantly affect the monitoring results. | ||
| + | |||
| + | == 4th September 2020 == | ||
| + | |||
| + | Due to the COVID19 stage 4 restriction, we haven't done the fieldwork for more than one month, now we are preparing to do the fieldwork next week. Our past experience shows there are some problems in our monitoring system, for example, the battery connection is not stable, more moisture in the box, the turbidity sensitivity is low. This week we have done a lot of work to solve these problems which will make our monitoring system more robust. | ||
| + | |||
| + | ==== Making more new sensors ==== | ||
| + | |||
| + | Currently, most the sensors we are using in Troups are with low sensitivity, due to the PCB problem, we have to connect the LED on the motor pins instead of the original LED pins, that makes the sensors less sensitive than the good ones. Now we have got some more new sensors, to obtain more accurate monitoring data, we will replace all the low sensitive sensors from next week. Now we have already completed all the sensor making and calibration, they are ready to do any work in the wetland! | ||
| + | |||
| + | ==== Update the box design ==== | ||
| + | |||
| + | As we mentioned, there are some problems on the box, the main problem is the cable hole at the bottom of the box, the hole allows water evaporation and condensation happens in the box and makes high moisture in the box, although we use some sponge to seal the hole, it still cannot completely solve the problem. Now we have used a cable gland in the box to seal the gap of the hole, the cable gland can also fix the length of the cable in the box, so we can also get rid of using more cable ties in the box. Also, the rope goes through the cable gland, the cable gland makes the rope tight, we do not need a carabiner in the box. The last thing we changed is the battery, the new 3.3v battery is much better than the previous ones, it can also fit the box perfectly. Now, as fewer wires in the box, it looks much cleaner than before. | ||
| + | |||
| + | [[File:New sensor box total.png|240px]] [[File:New sensor box top.png|400px]] [[File:New sensor box bottom.png|400px]] | ||
| + | |||
| + | |||
| + | ==10th September 2020 == | ||
| + | |||
| + | Some updates for the Troups turbidity sensors: | ||
| + | |||
| + | ==== Past available data analysis ==== | ||
| + | |||
| + | In the past more than one month, we have collected some data in Troups wetland, before we do the maintenance again in the wetland, we analysed the available data. For the current sensors in the wetland, some of them stopped logging after we installed them for several days, and some of them keep logging until September, this section, we will show the data from 24th July to 7th August(two weeks since we first install them). For some sites, there is a gap in the monitoring period, that means the sensor stopped logging and we lost that period of data. The following picture shows the summary of monitoring data for each site. | ||
| + | |||
| + | [[File:Troups data analysis summary new.png|1500px]] | ||
| + | |||
| + | Some points to explain these results: | ||
| + | |||
| + | * For each of the diagrams, orange points indicate the water depth(cm), the axis range is 0cm to 150cm, and the blue points indicate the turbidity(NTU), the axis range is 0NTU to 200NTU; | ||
| + | * No enough water depth data is collected after 1st August for SITE8 and INLET, so we can not see the water depth curve for these two sites; | ||
| + | * During the two weeks period, there was a 14.2mm rainfall event at 5th August, it can be seen the water depth and turbidity increment match this rainfall event; | ||
| + | * The inlet turbidity data had a significant jump at the beginning of the monitoring period, that may because some sand or litters stuck in the cover which caused the high results; | ||
| + | * The turbidity of SITE3 has a very big increase after a period of time, the problem may be caused by algae, as SITE3 is very shallow, the sensors are almost at the surface of the water, so more sunshine may increase the growth of the algae, when we do maintenance, we found this site has the most algae on the sensors; | ||
| + | * The depth of some sites(SITE5, 6,10) has the floating problem, this may caused by the BoSL air pressure sensor, we will fix this problem soon. | ||
| + | |||
| + | ==== Sensor replace and maintenance ==== | ||
| + | |||
| + | Finally, we went to the field to replace sensors, we haven't come here to replace sensors for around one month, most of the sensor stopped logging. Now we use our new sensors with enhanced sensor boxes, hopefully, it can solve the moisture problem. | ||
| + | |||
| + | We also checked the sensors in the field, after the long period time in the water, the covers of some sites contain a lot of algae, even some spiral shell(SITE3) on the turbidity sensor surface, that may cause the sensor to get higher results. | ||
| + | |||
| + | ==== maintenance of velocity sensors ==== | ||
| + | |||
| + | We checked the velocity sensors in the filed, one of them died because of the SIM module dead, this problem may be caused by the high moisture in the box, the others died because of the battery problems. To fix all the sensors and seal the sensor holes, we took all the velocity sensors back to the lab, and we will reinstall them after fixing all the problems. | ||
| + | |||
| + | == 18th September 2020 == | ||
| + | |||
| + | Today we have replaced the Troups sensor for weekly maintenance, we also calibrated all the old low-cost sensors and the GreenSpan sensors to do the data comparison, both the inlet data comparison and the outlet data comparison are listed below: | ||
| + | |||
| + | ==== Inlet data comparison ==== | ||
| + | |||
| + | The data we collected in the past week(2020/09/10 -- 2020/09/18) is presented in the following diagram, there were rainfall events at 13th, 17th of September: | ||
| + | |||
| + | [[File:Calibration data comparison 0918 inlet.png|800px]] | ||
| + | |||
| + | Some comments for the Inlet Data Comparison diagram above: | ||
| + | * To make sure all the result points can be well presented in the diagram, the vertical axis range is set to 0-700NTU; | ||
| + | * For the low-cost sensor, there are big values in the results, our hypothesis is some litters stuck in the cover, and caused the big analogue readings, some analogue readings get the upper limit; | ||
| + | * For the GreenSpan sensor, it can be seen a lot of reading is 0, that means the GreenSpan sensor has "NAN" result which means the turbidity is too high and out of the monitoring range, this problem is caused by a large amount of alga on the surface of the sensor, as the daily temperature is getting hotter, the alga grows much quicker than winter, therefore, the GS sensor won't be able to get an accurate result. | ||
| + | |||
| + | ==== Outlet data comparison ==== | ||
| + | |||
| + | The outlet data results are shown below: | ||
| + | |||
| + | [[File:Calibration data comparison 0918 outlet.png|800px]] | ||
| + | |||
| + | * It can be seen that both the green span sensor and the low-cost sensor monitored the rainfall event in the past week, the turbidity reached the peak during the those days; | ||
| + | * The turbidity trend of both sensors is similar in the past one week results; | ||
| + | * In the first three days, the differences between the two sensors are large while it was getting closer in the following days; | ||
| + | * GreenSpan sensor reported several "NAN" readings while the low-cost sensor kept working well; | ||
| + | |||
| + | |||
| + | In the future, we will change another cover of the Inlet sensor to make the inlet results better. | ||
| + | |||
| + | |||
| + | == 26th September 2020 == | ||
| + | |||
| + | This Thursday, we replaced the sensors in the wetland and did the calibration as usual, the inlet comparison and the outlet comparison can be seen as the following results: | ||
| + | |||
| + | ==== Inlet results comparison ==== | ||
| + | |||
| + | the following diagram shows the inlet results: | ||
| + | |||
| + | [[File:Calibration data comparison Inlet 0926.png|800px]] | ||
| + | |||
| + | * The low-cost sensor results are not accurate, the high turbidity(almost more than 600) is impossible in the inlet, when we did the calibration, we found a field snail on the surface of the sensor, that is the main reason which caused the super high turbidity results; | ||
| + | * The green span sensor got some increases at early 22nd and 23rd of September, which matches the rainfall events at those days; | ||
| + | * As the low-cost sensor also has this problem in the past weeks, we have changed the cover which will prevent litters or snail get inside the cover, now we are looking forward to seeing the results in the following week. | ||
| + | |||
| + | ==== Outlet results comparison ==== | ||
| + | |||
| + | the following diagram shows the outlet results: | ||
| + | |||
| + | [[File:Calibration data comparison outlet 0926 2.png|800px]] | ||
| + | |||
| + | * From the diagram above, it can be seen the two sensors got similar results in the past week, at last a few days, the results had some differences and the maximum difference is less than 10NTU; | ||
| + | * The trend of the two sensors are the same, and both of the sensors monitored the turbidity changes during the rainfall events; | ||
| + | *For the GreenSpan sensor, it still has some problem as it presented some 'NAN' value which is 0NTU points in the diagram, however, the low-cost turbidity sensor does not have this problem. | ||
| + | |||
| + | == 12th October 2020 == | ||
| + | |||
| + | ==== Sensor replacement and data comparison ==== | ||
| + | |||
| + | As too busy in the past a few days, the sensors have stood in the wetland for more than two weeks, now we have replaced them and get them maintained in the lab, and the comparison of the sensors have also completed. The data we compared is between 24th September and 11th October, during this period, there are big rainfall evens at 26th(18mm), 27th(6.2mm), 30th(2.4mm) of September, and 9.8mm at 1st October, 9.4mm at 5th October, 9.8mm at 8th October and 16.6mm at 9th October respectively. The following diagrams show the data comparison between the Low-cost turbidity and the GreenSpan sensor. | ||
| + | |||
| + | '''Inlet results comparison''' | ||
| + | |||
| + | The following diagram shows the Inlet data comparison: | ||
| + | |||
| + | [[File:Calibration data comparison 1012 inlet.png|1000px]] | ||
| + | |||
| + | * As we changed the cover of the Low-cost sensor, now the low-cost sensor does not have the high reading problem, the presented data above shows a reasonable continuous turbidity result; | ||
| + | * From the results above, both the low-cost sensor and the GreenSpan sensor monitored the rainfall events, as the high turbidity matches the rainfall events; | ||
| + | * For the GreenSpan sensor, there are many scattered points and the "NAN" results presented on the diagram, these results may be caused by the alga in front of the prob, and that problem may significantly affect the monitoring results; | ||
| + | * From the Low-cost sensor results, some jump points can also be seen especially between 1st October and 3rd October, our hypothesis is, some litters or snails flowed into the cover, and the caused the high monitoring results; | ||
| + | * By comparing the two sensors, although two sensors(especially GreenSpan sensor) both have jump points results, we can also see the similar trend of the turbidity changing at Inlet. | ||
| + | |||
| + | '''Outlet results comparison''' | ||
| + | |||
| + | The diagram below shows the Outlet data comparison: | ||
| + | |||
| + | [[File:Calibration data comparison 1012 outlet.png|1000px]] | ||
| + | |||
| + | * By comparing the data from the two sensors, it can be seen the monitoring results are similar between each other; | ||
| + | * For both sensors, the trend of the turbidity matches most of the rainfall events, but still have some changes with unclear reasons; | ||
| + | * For the GreenSpan sensor, there is an increase at 7th October which only 1.4mm rainfall on that day, also, there is a big jump at 10th/11th October which almost no rainfall during that time; | ||
| + | * For the Low-cost sensor, there is a growing trend at 9th October(with 16.6mm rainfall), however, there is no obvious peak with a big rainfall event, the low-cost sensor almost missed the event; | ||
| + | * The GreenSpan sensor still reported many "NAN" results. | ||
| + | |||
| + | ==== New testing sensor installation ==== | ||
| + | |||
| + | During the past a few weeks, we found the calibration curve of the "before cleaning" and "after cleaning" are similar, especially for the sensor only installed for one week. To understand how long is the best time for lab calibration and maintenance, we placed two new sensors for testing. | ||
| + | |||
| + | The two sensors are placed at Site 1, beside the original sensor, test sensor 1 will stay there without any cleaning, and test sensor 2 will stay there only with cleaning each week, then we can see the data results to see if we can place the sensors longer than one week, so we may reduce the frequency of the maintenance. We will see the performance. | ||
| + | |||
| + | == October 19th 2020 == | ||
| + | |||
| + | We have done the sensor maintenance and calibration for the past week, in the past week, there were rainfall events on 16th October(2.2mm) and 17th October(11.8mm), the comparison results can be seen below: | ||
| + | |||
| + | ==== Inlet Data Comparison ==== | ||
| + | |||
| + | [[File:Calibration data comparison 1019 inlet.png|1000px]] | ||
| + | |||
| + | * From the diagram above, it can be seen the monitoring results between the two sensors are similar before 19th October; | ||
| + | * The results of both sensors increased at 17th October which match the rainfall event; | ||
| + | * From late 18th, the GreenSpan sensor results increased significantly, that may caused by alga on the prob. | ||
| + | |||
| + | ==== Outlet Data Comparison ==== | ||
| + | |||
| + | [[File:Calibration data comparison 1019 outlet.png|1000px]] | ||
| + | |||
| + | * For the outlet data, the changing trend of the two sensors are similar; | ||
| + | * Both sensors reported some turbidity increments during dry weather days but the reason is not clear; | ||
| + | * The rainfall event on 17th caused the high turbidity at outlet which can be obviously seen on the diagram; | ||
| + | * There is a significant turbidity decrease after the rainfall event, the turbidity reaches around 15NTU; | ||
| + | * GreenSpan sensor still has some scattered points and "NAN" results with unclear reason. | ||
| + | |||
| + | == October 30th 2020 == | ||
| + | |||
| + | Finally, we got some time to update the monitoring results(between 19th and 27th) at Troups Wetland. | ||
| + | |||
| + | ==== Inlet Data Comaprison ==== | ||
| + | |||
| + | [[File:Calibration data comparison Inlet 1027.png|1000px|File:Calibration data comparison Inlet 1027.png]] | ||
| + | |||
| + | * From the data above, it can be seen the trends of the two sensors are very similar, both of the sensors monitored the rainfall event at 24th; | ||
| + | * The GreenSpan sensor had a big jump at 22nd which may be caused by some surface coverage on the prob; | ||
| + | * Due to the calibration problem, we can see the results of the low-cost sensor is slightly lower than the GreenSpan sensor, especially at the low turbidity water, the results is too low after applying the calibration equation. | ||
| + | |||
| + | ==== Outlet Data Comparion ==== | ||
| + | |||
| + | [[File:Calibration data comparison outlet 1027.png|1000px|File:Calibration data comparison outlet 1027.png]] | ||
| + | |||
| + | * The outlet results from the two sensors are not good enough to make comparisons, as the GreenSpan wiper caused ragging issues which makes a lot of alga on the surface, so a large number of results are "NAN"; | ||
| + | * For the results before mid-day of 21st, the results are similar for low-cost sensor and the GreenSpan sensor; | ||
| + | * The rigging may start from the mid-day of 21st as we can obviously see the data jumped much higher than usual. | ||
| + | |||
| + | The ragging of the alga is shown as the following picture: | ||
| + | |||
| + | [[File:Rigging greenspan.png|600px]] | ||
| + | |||
| + | |||
| + | == November 6th 2020 == | ||
| + | |||
| + | We have replaced all the sensors on 6th November, the data comparison can be seen as below. | ||
| + | |||
| + | ==== Inlet Data Comparison ==== | ||
| + | |||
| + | [[File:Calibration data comparison Inlet 1106.png|1000px]] | ||
| + | |||
| + | In the past a few days, the turbidity at the Inlet is very low, as the calibration curve is plotted as a linear regression curve from 9 points, so the results of the low turbidity solution is even lower than the actual value, therefore, the results of the low-cost sensor are pretty low, in the future, we will get a better calibration curve for the monitoring results. | ||
| + | |||
| + | ==== Outlet Data Comparison ==== | ||
| + | |||
| + | [[File:Calibration data comparison outlet 1106.png|1000px]] | ||
| + | |||
| + | In the first several days, the results of the Low-cost sensor and the Green Span sensor are very close, and they both monitored the rainfall event at 31st Novermber, we can see the turbidity at that day increased, however, after that, Green Span sensor started to have big jumping points, the hypothesis of the reason causing the bad results is the alga affects the results a lot. When we went to the field, still a lot of alga on the surface, although the wiper of the sensor cleans the surface, a large amount alga still on the sensor and very hard to get off. The main reason causing the poor monitoring results maybe the alga. | ||
| + | |||
| + | It is also a big challenge to avoid alga in the summertime, as the water level decreased during summer and the high temperature increases the growing rate of the alga, we may think about a way to get a better result from the Green Span sensor. | ||
| + | |||
| + | |||
| + | == February 2nd 2021 == | ||
| + | |||
| + | Until now, we have installed the sensors in the Troups Creek Wetland for about 6 months, after the Christmas holiday, we have already collected all the sensors from Troups and start to do some data analysis. | ||
| + | |||
| + | First, we do some raw data comparison for the low-cost sensor and Green Span sensor at both Inlet and Outlet. The comparison includes the data during the past 3 months. | ||
| + | |||
| + | ==== Inlet data comparison ==== | ||
| + | |||
| + | [[File:3 month Inlet comparison 0202.jpg|1000px]] | ||
| + | |||
| + | From the diagram above, some information can be summarised: | ||
| + | * For some weeks, the Low-cost sensor and Green Span sensor results are close after calibration; | ||
| + | * Low-cost sensor results have jumped a lot for a few weeks, that may be caused by some litters stuck in the cover which makes the light reflects too much to the phototransistor; | ||
| + | * From December, Green Span sensor results show a lot of scattered points, some of the results show very high reading, that may be caused by some ragging problem, also, as the water is too shallow at Inlet, Green span sensor cannot fully submerged in the water, the prob may out of the water, that may also cause high readings. | ||
| + | * Green Span sensor presented a lot of 'NAN' results, which means the turbidity is too high and out of the monitoring range(0-400NTU), this problem may be caused by some litters or stones stay in front of the prob which makes the reading too high. | ||
| + | |||
| + | |||
| + | ==== Outlet data comparison ==== | ||
| + | |||
| + | [[File:3 month outlet comparison 0202.jpg|1000px]] | ||
| + | |||
| + | For the outlet data: | ||
| + | |||
| + | * The Low-cost sensor and Green Span sensor results for some weeks match, the results are similar; | ||
| + | * For some weeks, although the results have big differences, they have similar pattern; | ||
| + | * From mid-December, Low-cost sensor results have a significant increase, that may because of more biofilm has grown on the sensor surface, as the temperature at those days is higher which will increase the growth rate; | ||
| + | * Ragging issue of the Green Span sensor caused a lot of 'NAN' results. | ||
| + | |||
| + | ==== Data analysis for all the sites ==== | ||
| + | |||
| + | After plotting the results for all the sites, the relationship between the Water Depth and Turbidity can be seen from the diagram below: | ||
| + | |||
| + | [[File:All sensor results 3 month.jpg|1400px]] | ||
| + | |||
| + | From the diagram, it can be seen: | ||
| + | |||
| + | * for most sites, the water depth has a positive correlation with the turbidity, that indicates rainfall events will cause the rise of turbidity; | ||
| + | * the turbidity at many sites increases at mid-December, which shows high temperature will cause more biofilm on the surface; | ||
| + | * Some sites present unusual high turbidity results which should be caused by biofilm, sediment or litters in the cover, for site 3, as the water level is too shallow, the low-cost turbidity may above the water, that may cause super high results. | ||
| + | * Due to connection problem, some depth data haven't been collected at some sites, that reports depth information '0'. | ||
| + | |||
| + | ==== Future work ==== | ||
| + | |||
| + | In the following weeks, some detailed data analysis will be done: | ||
| + | * Depth data should do some accurate calibration; | ||
| + | * Low-cost turbidity sensor data needs to be double-checked; | ||
| + | * Data quality code should be designed and applied to the turbidity data; | ||
| + | * Green Span sensor data should also be cleaned and compared with the Low-cost sensor data; | ||
| + | * Start to design biofilm detection for Turbidity sensor. | ||
| + | |||
| + | == July 11th 2022 == | ||
| + | |||
| + | ==== Data Validation and Timeseries data comparison ==== | ||
| + | |||
| + | We finally got some time to validate the turbidity sensor data. Before the validation process, the low-quality data needs to be distinguished and cleaned. The decisions made were done according to a number of criteria based on the available information. The information can be related to i) the data itself, ii) the maintenance information, iii) the environment and any problems from the measurement process, or iv) a combination of these three elements. Based on the aforementioned information, criteria were designed to filter the valid data for further analysis: | ||
| + | |||
| + | * Criterion 1: senor monitoring status (in-water for monitoring or not). This test checks if the sensor stays in the water for monitoring tasks based on the water depth. The sensor should be fully submerged in the water to make sure the turbidity sensor could provide a reliable monitoring result. If the water is too shallow which is below the top surface of the turbidity sensor, the collected data can be identified as not valid. | ||
| + | * Criterion 2: Missing data. For battery issues, hardware or software issues, the data was not collected by the sensor, which means the data was missed at that timestamp. The missing data can be identified as not valid. | ||
| + | * Criterion 3: The monitoring turbidity is out of the reliable detection range. For the two sensors, after the calibration curves had been applied to the raw data, the calibrated turbidity should be within the reliable detection range. For the Greenspan turbidity sensor, the detection range is 0NTU – 400NTU. For the low-cost turbidity sensor, the solution of the lab calibration was up to 250NTU, therefore, the reliable detection range of the low-cost sensor is 0NTU – 250NTU. The calibrated turbidity which is not within the reliable detection range of the corresponding sensors can be identified as not valid. | ||
| + | * Criterion 4: Unreasonable data. If the turbidity data kept increasing or decreasing without any rational reason, that data can be identified as uncertain data. | ||
| + | * Criterion 5: Uncertain data with dirt on the probe. If dirt such as sediments, algae or snails were observed attaching on the surface of the sensor probe when doing maintenance, that may significantly affect the sensor reading. Since it is hard to know when the dirt started to attach on the sensor, the data collected during the monitoring period between the last maintenance and current maintenance was identified as uncertain data. | ||
| + | * Criterion 6: Duration after the last maintenance. If the sensor hadn’t been maintained for more than two weeks, the data collected which was longer than two weeks from the last maintenance was marked as uncertain data. | ||
| + | * Criterion 7: Erratic increase or decrease values. Sudden or erratic increase or decrease of values, or unrealistic gradients (according to physical processes and local environment and conditions) should be filtered. Page-Hinckley test was applied to the sensor data (Gama et al., 2013; Mouss et al., 2004) to filter the erratic increase or decrease data. Generally, by following the Page-Hinckley testing method, the absolute sum of the difference between the residue and the cumulative average is compared with a threshold, this threshold needs to set by an iteration process with the moving window together. For different sensors, the moving average and threshold need to be set differently. As the residue of the turbidity results forms a normal distribution, the percentage of the total removed data should be around 10%. With this criterion, a sensitivity matrix can be designed for each sensor to show how much data will be removed with different moving windows and thresholds, so the right pair of moving windows and thresholds can be selected. | ||
| + | |||
| + | Also, to understand the turbidity changes in the wetland, the wind speed data, water level and temperature was plotted together for comparison, the following graphs are showing the Timeseries data of the turbidity and other weather parameters. | ||
| + | [[File:Turbidity and weather timeseries data at wetland inlet.png|1000px|frameless|Turbidity and weather timeseries data at wetland inlet]] | ||
| + | [[File:Turbidity and weather timeseries data at wetland outlet revised.jpg|1000px|frameless|Turbidity and weather timeseries data at wetland outlet]] | ||
| + | |||
| + | ==== Statistical analysis of the comparison between the two sensors ==== | ||
| + | A comparison was made between the data from the two sensors, some statistical analyses were also needed to understand the correlation between the two sensors. To compare the correlation between the two sensors’ data, the monitoring results of both sensors were plotted in the same graph with different axis. The horizontal axis indicates the Greenspan sensor results while the vertical axis presents the low-cost sensor results. If the results from the two sensors were similar, they were plotted around the y=x centre line. Since the monitoring results of both sensors showed jumping issues, in order to mitigate the impacts of the scattered points, the hourly average data was used for the data comparison. Also, the correlation between the two sensors’ data was assessed, both the Pearson correlation test Spearman rank correlation test was applied to the collected data. If the monitoring results were identical, the results would form a perfect linear relationship, therefore, to assess the linear association between the two datasets, a Pearson test was applied. However, as both of the sensor results were not normally distributed, a Spearman test was conducted to statistically compare the difference between them. | ||
| + | |||
| + | From the Figure below, it can be seen that the orange line in the graph is the y=x centre line. For the inlet monitoring results, the slope of the trend line is 0.847 which indicates the data points are centralized around the centre line. There are some data points above the centre line which means our low-cost sensor shows higher turbidity than the Greenspan sensor. This can also be seen from the time series plot in Figure 6 - the low-cost sensor results show more scattered jumping points above the Greenspan results. For the entire valid data, spearman rank correlation results are shown in the table below. The correlation coefficient of the inlet results is 0.6629 which means a moderate correlation between the low-cost turbidity sensor and the Greenspan sensor, where the p-value of the spearman test is less than 0.01, which means the correlation between the two sensors’ data is statistically significant (Zar, 1972). | ||
| + | For the outlet monitoring data, the slope of the trendline is 0.13 which means more data points are under the centre line, showing the Greenspan sensor results are higher than the low-cost sensor, this can be also observed from the time series data in the following Figure. Some of the data points are higher than the centre line, these points with high low-cost sensor results come from December, at that period, the low-cost sensor showed a continuously rising trend. From the statistical analysis results, the correlation coefficient of the outlet data is 0.49 which still shows a moderate correlation. However, the correlation coefficient of the outlet data is smaller than the inlet which indicates the correlation at the outlet is weaker than the inlet, that is because the monitoring condition at the outlet is more complex than at the inlet, as the water is deeper and less responsive to rainfall and big wind. The p-value of the spearman test is less than 0.01 as well, which also shows a statistically significant correlation. | ||
| + | |||
| + | [[File:Statistical analysis of the comparison between the two sensor.png|1000px|frameless|Plot of the Greenspan sensor results vs Low-cost sensor results at both wetland inlet and outlet, monitoring results [NTU] at inlet (left), monitoring results [NTU] at outlet (right), the orange line show the centre line (y=x), and the blue dash line is the linear trend line for the data series, linear trendline equation and R square are also shown in each diagram ]] | ||
| + | |||
| + | [[File:Sensor performance comparison table.png|1000px|frameless|Summary of the Spearman rank test and Pearson test results]] | ||
| + | |||
| + | ==== Biofouling impact of the sensors ==== | ||
| + | |||
| + | Biofilm is the prevailing microbial life which is likely to attach on the surface of a structure. It is the main cause of biofouling. After the sensors were deployed in the water for a period of time, biofilm accumulated on the surface of the probe which may have affected the sensor readings. Theoretically, the more biofilm on the probe, the higher reading will be presented as more light will be reflected by the biofilm. To assess the impact of the biofouling, the calibration information was compared. For each monitoring period, the after-cleaning calibration curve (cleaned sensor) and before-cleaning calibration curve (sensor potentially with biofilm) were compared. When doing the comparison, a different raw reading was set for the sensors to make their actual turbidity readings around the 25%, 50% and 75% percentile of the entire monitoring results. After applying the raw readings to the different calibration curves, the actual turbidity results were determined for both before-cleaning and after-cleaning conditions, then the relative difference was able to be calculated for further comparison. | ||
| + | |||
| + | R=(T_A-T_B)/T_A | ||
| + | |||
| + | Where R is the relative difference between ‘after cleaning turbidity’ and ‘before cleaning turbidity’. T_A is the ‘after-cleaning turbidity’ reading for one specific monitoring period, T_B is the ‘before-cleaning turbidity’ reading for one specific monitoring period. | ||
| + | To assess the biofouling issue, the relationship between the relative difference of before-cleaning and after-cleaning readings and the in-water time should be compared to evaluate if the biofilm growth could affect the turbidity readings. The relative difference of the low-cost sensors and the Greenspan sensor were summarised, a Wilcoxon Rank Sum test was conducted to assess the difference between the low-cost turbidity sensor and Greenspan sensor for biofouling issues, where the acceptable p-value of the Wilcoxon Rank Sum test is 0.05. | ||
| + | |||
| + | The figure below shows the relative difference of different sensors for various monitoring period. The in-water time varies from 3 to 36 days. From the graph, it can be seen that as the turbidity increases, the relative difference decreases, and there is no obvious relationship can be seen between the relative difference and the sensor in-water time which means the both the low-cost turbidity sensor and Greenspan sensor are not affected by the biofouling issue. | ||
| + | |||
| + | [[File:Biofouling relative difference.png|600px|frameless|Relative difference between the after-cleaning turbidity and before-cleaning turbidity for each sensor, showing the relationship between the in-water monitoring time and the relative difference of each sensor]] | ||
| + | |||
| + | Apart from the in-water time impact, the relative difference of low-cost sensor and Greenspan sensor in the two monitoring sites are summarized in Figure 8. From the box plot graph, it can be seen that the relative difference of all the sensors is distributed around 0, however the inlet low-cost sensors show bias especially in the low turbidity condition. The median of the inlet low-cost sensor’s relative difference is 11.6%, 5.6% and 2.7% for 25%, 50% and 75% percentile turbidity respectively. For other sensors, the median values are all around 0 (between -2% to 2%) with different turbidity condition. This result shows the inlet low-cost sensor presents higher readings after a period of time in-water monitoring. As both the low-cost turbidity sensor and the Greenspan sensor are monitoring at the same location, and they provided different results, which means the low-cost sensor show a higher uncertainty than the Greenspan sensor. The uncertainty may come from the monitoring condition of the sensors. For the low-cost sensor, sediment is easy to cumulate in the cover which cause higher reading after a period of deployment. However, the Greenspan sensor probe is facing downstream in the open channel, less dirt was attached on the sensor surface, which makes the sensor readings more stable and shows less uncertainty. That is also the reason of low-cost sensor is showing more variability than the Greenspan sensor. However, although the low-cost sensor is showing more variability than the Greenspan sensor, from the Wilcoxon Rank Sum test results (summarised in the following Table), the p-value of the test is provided in the table. A p-value of greater than 0.05 will reject the null hypothesis that the median of differences between the two kinds of sensor data equals to 0. it can be seen that the variations between the low-cost sensor and the Greenspan sensor at both inlet and outlet has no statistical difference, which means statistically, the two sensors are providing the same performance. | ||
| + | |||
| + | [[File:Biofouling barchart.png|800px|frameless|. Box plot of the relative difference of sensors at both inlet and outlet for biofouling issue, the box plot shows maximum, 75% percentile, median, 25% percentile and minimum values of the relative difference of the sensors in the monitoring sites, different colours indicate different sensors at the two monitoring sites.]] | ||
| + | |||
| + | [[File:Biofouling Wilcoxon rank test result.png|800px|frameless|Wilcoxon Rank Sum Test results for biofouling assessment. A p-value of greater than 0.05 will reject the null hypothesis that the median of differences between the two kinds of sensor data equals to 0. ]] | ||
| + | |||
| + | == 10/05/2023 Circuit upgrade == | ||
| + | |||
| + | A new circuit was developed to remove the need for a sunlight cover. It uses a transimpedance amplifier to convert the current from a photodiode into a voltage. In theory this should produce a highly linear voltage that is in proportion to the light intensity. This subtraction of ambient background light can be done in software. (The following is not the exact circuit used.) | ||
| + | |||
| + | [[File:Loop2.png|frameless]]<br> | ||
| + | |||
| + | Notably this proposed circuit also contains a voltage-current regulator that precisely controls the current through the LEDs. This enables using a digital (or true analog pin) pin to input a voltage signal that is converted into a constant current. This is important as the IV curve of LEDs change in response to temperature, and thus a circuit that can dynamically react and keep current through the LEDs constant is important. However even precise current control LEDs' efficiency is still dependent on temperature. As temperature decreases, LEDs become more efficient at the same current. Thus a temperature sensor is needed to cancel the effects of LEDs changing efficiency. Note that there is an internal temperature sensor on the SAMD21. | ||
| + | |||
| + | [[File:Loopp.png|frameless]]<br> | ||
| + | |||
| + | The simulated performace shows a very fast settling time in the order of a few microseconds. This is important to minimising the on time of the LEDs which is the largest current drain in the circuit and to prevent thermal damage:<br> | ||
| + | [[File:Sim graph.png|frameless]]<br> | ||
| + | Note that no stability analysis in frequency domain was performed and the general reccomendation to ensure a phase margin of 45 degrees was ignored. (This turned out to not be a good idea as the chosen values of resistors/capacitors had large overshoot and needed to altered on the physical circuit). | ||
| + | |||
| + | <br> | ||
| + | [[File:Screenshot 2023-06-27 091814.png|frameless]]<br> | ||
| + | [[File:Screenshot 2023-06-27 091836.png|frameless]] | ||
| + | |||
| + | The circuit was designed with speed in mind so that the On time of LEDs which draw a large amount of current is minimised. | ||
| + | |||
| + | Another feature is that it uses an analog mux to switch the gain of the transimpedance amplifier. This enables trading accuracy for dynamic measurement range and vice versa. This is more beneficial compared to using oversampling on the Arduino as it reduces noise and does increase the sampling time when doing analog read. This is also important to greatly minimising the on time of the LEDs which are the biggest power draw in the circuit. | ||
| + | |||
| + | With the opa4322, a shutdown pin is included. When shutdown is activated, the output of the op amp goes into high impedance. This is an important feature of the op amp as it can be used to properly turn off the voltage-current circuit and prevent any unnecessary leakage of current through the LED. As even when there is a LOW signal from a digital pin it not exactly a 0V signal. | ||
| + | |||
| + | And physically it looks like this:<br> | ||
| + | [[File:Screenshot 2023-06-27 092721.png|frameless]]<br> | ||
| + | The test setup looks like this. A tube of various turbidity solution is inserted into a 3D printed "tube" that holds the photodiode and LEDs.<br> | ||
| + | [[File:20230316 164057.jpg|frameless]] | ||
| + | |||
| + | Unfortunately only basic stability analysis was done on the transimpedance amplifier and voltage-current circuits, thus the initial circuit had problems with signal overshoot etc. This meant soldering on additional capacitors and changing resistors values to get the circuit to behave best. The gains on the TIA was also altered to produce a better dynamic range that would not be saturated by sunlight. | ||
| + | |||
| + | For the voltage-current convertor, the dampening capacitor had to be doubled. Tripling this causes instablity, (online sources reccomend a series resistor at these high capacitance to help improve stability). The feedback resistance was also increased. | ||
| + | |||
| + | (I took a bunch of oscilloscope screenshots but did not bother to label or annotate them. So now I do not remember what is what...Here is one of the recent ones) | ||
| + | In the following, the pink trace represents the signal into the voltage-current converter. The yellow is the voltage drop of the resistor that sets relationship of I=V/R. The blue is the signal output voltage of the TIA at the analog pin. Note that each x-tick represents 1us and that the settling time is within microseconds.<br> | ||
| + | [[File:DS1Z QuickPrint24.png|frameless]] | ||
| + | |||
| + | In another reading, the blue trace is now the voltage of VCC. Notice that there is a slight dip in the VCC pin when the LEDs are turned on. (This can affect the voltage reference etc).<br> | ||
| + | [[File:DS1Z QuickPrint20.png|frameless]] | ||
| + | |||
| + | In the first experiment a 90 degree LED on the left and right was used. As expected this configuration of LEDs is non-linear at high turbidity solutions. <br> | ||
| + | [[File:Screenshot 2023-06-27 092528.png|frameless]] | ||
| + | |||
| + | In all of the following experiments both LEDs were 90 degree on one side and the On-Off reading is presented. Note that different settings were used such as different gains, oversampling bits etc, this means the y-axis may not be comparable across the graphs. | ||
| + | |||
| + | On cloudy day in which clouds came and passed through:<br> | ||
| + | [[File:Screenshot 2023-06-27 102253.png|frameless]]<br> | ||
| + | Notably the sunlight rejection seems to not be working at all as the outdoor vs indoor curves differ drastically. This was then repeated using a different gain setting. The same discrepancy was seen...<br> | ||
| + | [[File:Screenshot 2023-06-27 102657.png|frameless]]<br> | ||
| + | Note that in both of these graphs the cloud moved in and out. | ||
| + | |||
| + | Now the experimented was repeated but outdoor results were take in constant direct sunlight (without clouds).<br> | ||
| + | [[File:Screenshot 2023-06-27 102958.png|frameless]]<br> | ||
| + | Unfortunately this shows that On-Off readings are not enough to remove ambient sunlight from the signal. However the results show that measurements are reproducible and accurate. Note the strong correlation between the two curves and that they seem to be seperated by some constant. | ||
| + | |||
| + | In order to better understand the relationship between incident light and voltage signal, the following experiment was devised. An external LED connected to an external wall connected current-source was used to simulate sunlight. Ancedotally the effects of LED heating could be noticed on measurement readings. Thus between readings the LEDs were left to cool for a few seconds. <br> | ||
| + | |||
| + | [[File:Cabana.png|frameless]]<br> | ||
| + | |||
| + | The results of this is quiet interesting. Residuals show that there is some curving in both the On and Off readings. This is unexpected as the circuit was designed with linearity in mind (with simulations showing linearity). | ||
| + | |||
| + | A collection of all results is seen below: | ||
| + | [[File:Turbidity results.xlsx|thumb]]<br> | ||
| + | |||
| + | == 24/10/2023 Version 1.0 Results == | ||
| + | |||
| + | [[File:Tubrdidi 1.0.png|frameless]] | ||
| + | [[File:Turbiditiy+back.png|frameless]] | ||
| + | |||
| + | The curving issue with the old circuit has been fixed. It was discovered that due to the high-current burst of the LEDs, it was sagging down the voltage power rails. This caused the analog voltage reference that analog-to-digital converted (analogRead) relies on to sag as well and thus causing unexpected curving of results. | ||
| + | |||
| + | Hence this new circuit was designed to mitigate the effects of high-current bursts from the LED onto the ADC . | ||
| + | |||
| + | The schematic is here: | ||
| + | [[File:Turbidity 10.pdf|frameless]] | ||
| + | |||
| + | Therefore a new custom PCB building and improving on the previous work was integrated into a small 5cm x 2cm form factor. This prototype version has the following improvements: | ||
| + | * Large amounts of decoupling capacitors to reduce the effects of voltage sagging from the high-current burst. | ||
| + | * High accuracy 12 bit ADC from TI (with 10.5 effective number of noise free bits). | ||
| + | * Carefully routing/placement to minimise the effects of noise. | ||
| + | * Temperature sensor accurate to 0.5C. | ||
| + | * Very low temperature coefficient components. | ||
| + | * Improved linearity (as foreseen by simulation results). | ||
| + | * Minimized power consumption | ||
| + | * On-board negative voltage generator producing -6.6V bias across the photodiode for maximised linearity response. | ||
| + | |||
| + | As a result of these improvements (especially the use of very low temperature coefficient components), the price per single board is ~$60. While this is a large increase in price from Mao's design it still pales in comparison to commerical sensors which are in the thousands. | ||
| + | |||
| + | However there are a few potential issues with this specific version: | ||
| + | * The large amount of decoupling capacitors means more leakage current. However the amount of leakage current depends heavily on the temperature. At 25C it is estimated (very roughly) that the leakage current is ~20uA. Then at 50C it is very roughly estimated to increase to ~300uA. Again these are only rough estimates! The need for many capacitors is also required to bypass the large amount of resistance on the power cables. | ||
| + | * The ADC like all SPI devices are active low on its slave select pin. This is problematic as the slave select pin is directly connected to an Arduino pin without any pull up and thus by default is always active. This consequently interferes with the bootloading of atmega328p due to the shared SPI lines. | ||
| + | * The ADC was incorrectly wired (with a power pin being incorrectly connected to ground. The schematic shows this issue being fixed) and thus could not be tested in this version. Attempts to try to do tricky soldering and properly connect it all failed. | ||
| + | * The 8Mhz crystal for the Arduino had its footprint incorrectly defined. Thus for the purposes of evaluating this prototype it was removed and the internal 8Mhz oscillator was used. No issues using the internal oscillator was observed. However it is known that having an external 8Mhz crystal makes UART much much reliable. And thus whilst it is possible to "get away" without one, it is strongly recommended to keep it. | ||
| + | |||
| + | A new version of the PCB was developed to address the above issues and will be shown in a later section below. | ||
| + | |||
| + | 1. The following tests and discoveries related to this new board are shown below: | ||
| + | Due to the much more sensitive nature of the circuitry even when using low temperature coefficient components, using a heat gun set at 70C is enough to cause a measureable distortion in the measurements. Unfortunately the effects of this temperature fluctutations was not recorded exactly. However it is believed that software temperature calibration will be mandatory to avoid the effect of temperature changes when in the field. | ||
| + | |||
| + | 2. When taking the board outside and pointing it directly at the sun on a 26C degree day, it was discovered that the sun was capable of saturating the photodiode measurement circuit when using. Hence the gain of the measurement circuit was lowered by soldering on resistor in parallel to the photodiode feedback resistor to change the overall feedback resistance from 3K to 616 Ohms. This proved fruitful as when pointing it to directly into the sun, a voltage of 1100mV was measured using a multimeter. Converting this measurement into a photodiode current results in roughly: 1100mV/616Ohms=~1.8mA (Note this already accounts for the additional 100mV bias voltage on the op amp.). This value of 1.8mA then provides an estimate of the worst-case sunlight interference that occurs when the photodiode in pointed directly at the sun. | ||
| + | |||
| + | It is stressed however that this only occurs when the photodiode is very very closely pointed to the sun (within a few degrees). Furthermore from ancedotal experience of pointing that photodiode at the sun, there is a lot of variance in sunlight intensity. Specifically, on the day this testing was done, it featured very clear skies and no obstruction of sunlight. However upon returning an hr later to repeat this experiment, the measured sunlight intensity drastically decreased by ~60% again with no obstruction from clouds. | ||
| + | |||
| + | 3. The photodiode light measuring circuit displays a shockingly unexpected amount of linearity and accuracy. As evidenced by the following videos where the LEDs are directly pointed at the photodiode and a large array of external IR LEDs is used to simulate strong sunlight interference. This is shown below. Note that due to the strong directionality of the photodiode, a large amount of light misses the photodiode. | ||
| + | |||
| + | [[File:LED sunlight array.jpg|frameless]] | ||
| + | |||
| + | In these tests the magnitude of the On-Off signal (which is measured as Vpp in the oscilloscope) always stays constant regardless of external interference. Note due to aforementioned issues of saturation, the value of the feedback resistance was reduced even further from 616 Ohms to 308.5 Ohms. Note that the LED was pulsed for 20us which is the hump in the middle. The left and right regions are when the LED is off. As seen a constant Vpp of 1.9V was maintained regardless how much artifical sunlight is shined. Examining the maximum voltage, this then translates into a photodiode current of (2.2V-0.1V)/308.5Ohms=7.2mA. Linearity with these large currents is not guranteed by any photodiode manufactures. For the SFH203FA used, it is only guranteed to be linear up to 50uA. | ||
| + | |||
| + | [[File:Video of turbidity linearity.mp4|frameless]] | ||
| + | |||
| + | Given that linearity up to 7.2mA has been proven this, it significantly dwarfs the worst-case sunlight current of 1.8mA. This is promising as it means that even in high amounts of sunlight interference, linearity still holds. | ||
| + | |||
| + | 4. The effects of noise within the measurement circuit was also measured seen below. Note that this is zoomed in on when the LED signal is ON: | ||
| + | |||
| + | [[File:Noise measurement of turbidity.mp4|frameless]] | ||
| + | |||
| + | Examining the variance (shown in the bottom right of the oscilloscope) it fluctuates from 250uV to 450uV. Taking the largest variance and converting it into standard deviation, sqrt(450uV)=~22uV. For a 99.7% confidence interval, this then becomes 22uV*3=±66uV or a range of 132uV. This is a very small amount of electrical noise, and this translates into 14.7 noise free number of bits. Working shown below: | ||
| + | |||
| + | [[File:Number of noise free bits.png|frameless]] | ||
| + | |||
| + | Currently the ADC only has 10.5 effective number of bits. Thus it is strongly upgrading from that ADC to fully utilise those 14.7 bits of information. | ||
| + | |||
| + | == 23/02/2024 Version 2.1 Results == | ||
| + | |||
| + | * ADC was upgraded to 16 bits (along with adding a 16 bit capable voltage reference). | ||
| + | |||
| + | The following is the calibration curves in 3 different enviroments: "inside", "outside synthetic (using LEDs to simulate sunlight)", "outside real". This was measured using a sample of 25. | ||
| + | |||
| + | Note: | ||
| + | * Due to the circuit design, there is an constant offset of ~1986 bits. This means a reading of 1986 actually correlates with a 0 reading on the photodiode. | ||
| + | * The outside synthetic test using LEDs had a stronger "sunlight" compared to real sunlight. i.e. The synthetic test had an average Off reading of ~4000 bits, whereas the outside test had an average Off reading of ~2400 bits. This then subsequently means: (4000-1986)=2014 bits of synthetic background sunlight vs the (2400-1986)=414 bits of background real sunlight. That is the synthetic test was exposed to 5x more sunlight. | ||
| + | * Only the first two "outside real" datapoints were collected as the sensor promptly broke afterwards due to bad wiring. | ||
| + | |||
| + | [[File:Sunlight rejection test.png|frameless]] | ||
| + | [[File:Table of calibration curves numerical.png|frameless]] | ||
| + | |||
| + | (Some of the standard deviation values are incorrectly absurdly large, not sure why but most likely due to a precision bug in the Arduino code.) | ||
| + | |||
| + | Shown above is the On-Off readings plotted in all 3 enviroments. As shown the calibration curves are all basically identical. The y-intercept for both equations was set to 0 since it essentially goes through the origin. Using the indoor's calibration curve: On-Off = 0.3335 * NTU, rearranging this then becomes NTU = 2.999 * (On-off). Hence each increment of On-off is worth approximately 3 NTU. Furthermore, taking the average SD(On-Off) of the valid datapoints it is about 5. Converting this, it then becomes 5*3=15 NTU standard deviation. | ||
| + | |||
| + | [[File:Plot of sunlight error.png|frameless]] | ||
| + | |||
| + | Now plotting the error in reading between "inside" and "outside synthetic" (using the formula: inside - outside synthetic). Again the Y-axis can be converted to NTU by multiplying it by 3. Hence the maximum sunlight error is: 2.76 * 3 = 8.3 NTU. Given that there is no particular pattern in that plot, it seems that it may really be experimental error. | ||
| + | |||
| + | Other points: | ||
| + | * The maximum value that the ADC can read is 2^16=65536 bits. Hence converting this into NTU, the maximum NTU reading of the sensor would then be: 65536*3=196608 NTU. | ||
| + | * Examining the "On" column within the table, the largest reading is 5010.36 bits which leaves a large amount of headroom for sunlight rejection. For reference, the ratio of the maximum ADC reading and the largest reading is (65536/5010.36)=13. Meaning that the sensor can tolerate up to 13 times the outside synthetic sunlight intensity. | ||
| + | * [[File:Turbidity resistance jumper.png|frameless]]. | ||
| + | * Included on the PCB is a jumper that can be soldered to toggle its alternate "high sunlight rejection but reduced accuracy mode". Meaning that the calibration conversion would then become: NTU = 30 * (On-off), essentially multiplying the NTU per (On-off) increment by 10x. This could in theory further increase the maximum sunlight rejection intensity to 130 times what was used in the outside synthetic sunlight intensity. Given that both outside tests have so much headroom for sunlight rejection, this mode was not tested. | ||
| + | * From other informal testing, it is noted that this "high sunlight rejection" mode is necessary to be able to point the sensor directly at the sun without it saturating the ADC. This is only achievable by deliberatly pointing the sensor within rougly a few degrees of where the sun is. This would then in theory increase the 15 NTU standard deviation to 10*15=150 NTU of standard deviation which would mean much more samples would have to be taken to compensate. However that is only a theoretical extrapolation and the standard deviation may be no where near that high in reality. | ||
| + | * Due to power constraints, the maximum sampling rate is about 4,500 Hz which is more than sufficient. | ||
| + | * When the sensor is completely dry, the On-off reading in air is 0 NTU. When the sensor has been dipped into water and then lifted out into the air it then reads (40*3)=120 NTU. This is due to a small amount of residual water sticking to around the bottom of the opening. | ||
| + | * The cost in PCB components for a single sensor is roughly $67 USD (using 1 unit pricing). | ||
| + | |||
| + | Lastly due to using two LEDs, it may be possible to implement biofilm detection by turning on only one LED at a time and observing whether there is a large discrepancy between the two measurements. | ||
| + | This technique may be applicable to detecting when the sensor is submersed or in open air as in air only the bottom LED is covered by residual water. | ||
| − | + | == 15/03/2024 Current draw == | |
| + | The measured current when the circuit is active and taking measurements is 12.71mA and takes 80ms to do so. The sleep current is about 45uA. Taking a weighted average of current draw assuming a sample is taken every 6 minutes: (359920ms*45uA+80ms*12.71mA)/360000ms=48uA. | ||
| − | + | == October 1st 2024 Turbidity, EC sensor version 1 == | |
| + | The previous Turbidity sensor (with single LED and single PT) was updated in the past weeks. As the old turbidity sensor's in-air reading is not 0, it is hard to understand if the sensor reading is in-water turbidity reading or in-air reading. In this case, we have merge the EC sensor and the turbidity sensor to one sensor which is the Turbidity, EC sensor, and this design is version 1. | ||
| − | + | We simply added a screw terminal and a 100ohm resistor in the circuit and connecting to the AT-mega 328 chip, the schematic is shown below: | |
| − | [[File: | + | [[File:Schematic v1 .jpg|600px]] |
| − | + | and the PCB has been updated, and the 3d render is shown below: | |
| − | + | [[File:3d render front.png|400px]] | |
| + | [[File:3d render back.png|400px]] | ||
| − | + | With connecting the screw terminal with two steel rod,, we can use this EC sensor to detect the water, if the reading is not 0, it means EC sensor is submerged in the water so the Turbidity sensor is in water as well, then we know the reading is the water turbidity reading. | |
| − | + | Now the design file is sent to the manufacuturer for production and testing. | |
Latest revision as of 03:57, 1 October 2024
Contents
- 1 Publication
- 2 12th November 2019
- 3 13th November 2019
- 4 17th November 2019
- 5 19th November 2019
- 6 20th November 2019
- 7 21th Novermber 2019
- 8 23th Novermber 2019
- 9 27th November 2019
- 10 28th November 2019
- 11 29th November 2019
- 12 2nd December 2019
- 13 3rd December 2019
- 14 4th December 2019
- 15 5th December 2019
- 16 6th December 2019
- 17 10th December 2019
- 18 18th December 2019
- 19 19th December 2019
- 20 20th January 2020
- 21 22 January 2020
- 22 24th January 2020
- 23 4th February 2020
- 24 10 February 2020
- 25 13 February 2020
- 26 14 February 2020
- 27 16 February 2020
- 28 17 February 2020
- 29 19 February 2020
- 30 20 February 2020
- 31 24 February 2020
- 32 27 February 2020
- 33 2nd March 2020
- 34 3rd March 2020
- 35 4th March 2020
- 36 12th March 2020
- 37 14th March 2020
- 38 16th March 2020
- 39 17th March 2020
- 40 18th March 2020
- 41 19th March 2020
- 42 24th March 2020
- 43 26th March 2020
- 44 27th March 2020
- 45 4th April 2020
- 46 5th May 2020
- 47 9th May 2020
- 48 14th May 2020
- 49 16th May 2020
- 50 18th May 2020
- 51 26 May 2020 Sensor Installation
- 52 1 June 2020
- 53 18th June 2020
- 54 19th June 2020
- 55 21st June 2020 Data Comparison
- 56 28th June 2020 second Data Comparison
- 57 8th July 2020 Third Data Comparison
- 58 15th July 2020 Fourth Data Comparison
- 59 24th July 2020
- 60 29th July 2020
- 61 1st August 2020
- 62 4th September 2020
- 63 10th September 2020
- 64 18th September 2020
- 65 26th September 2020
- 66 12th October 2020
- 67 October 19th 2020
- 68 October 30th 2020
- 69 November 6th 2020
- 70 February 2nd 2021
- 71 July 11th 2022
- 72 10/05/2023 Circuit upgrade
- 73 24/10/2023 Version 1.0 Results
- 74 23/02/2024 Version 2.1 Results
- 75 15/03/2024 Current draw
- 76 October 1st 2024 Turbidity, EC sensor version 1
Publication
Please see the following link for the publication of the low-cost turbidity sensor
Website link: https://www.mdpi.com/1424-8220/24/12/3926
PDF version:https://www.mdpi.com/1424-8220/24/12/3926/pdf
12th November 2019
So we finally made some nice progress with the Turbidity Sensor design.
The first step was to print our case using our 3D printer. Here it is:
Next step was to test out some hardware for the little guy. We bought two main things: (1) a LED that puts out 850nm wavelength and (2) a phototransistor. The details of the connection we used is here:
We also needed some resistors in the circuit, a 5v power supply and something to read the output (obviously, we used an Arduino)
Next step, put it all together and see if it works! So, we used some epoxy and wired this all up to make this sensor:
Next step, test the little bugger. We did this using turbidity solutions and a deep cylinder (at least 100mm deep). We tested five turbidity solutions ranging from 500 NTU to 1NTU (tap water). Here are the results we got:
So, in conclusion, we are rather happy with the workings of this cheap turbidity sensor. It costs less than $5 AUD in components, and a little time to put together. The only issue is that the range of the sensor is really limited to just 0 to 500NTU; anything higher and we think we will need to include a photo-diode alongside the phototransistor to get those big NTU values. Also, we are concerned with the energy use that this little puppy dog may take up - the resistors are even heating up (NOT A GOOD SIGN!). The last thing we want to fix is to make this all run on 3.3v instead of 5v...our BoSL board is a 3.3 volt machine, so we want to keep that consistent. Finally (I know, I said the last thing was the final, but this will be) we need to continue to develop our turbidity wiping mechanism...turbidity probes need to be cleaned a lot, so a good wiper is essential or readings are lets just say poor...
Over and out for today.
13th November 2019
So, today we began making our circuitry for the new turbidity sensor. It is looking good, but when we tried to print the board on our new PCB printer, the ink was all dried up! Come on Voltera, please send us the new ink so we can start printing our boards again! Here is an image of the circuit we made today in an easy to use a program called EasyEDA.
17th November 2019
We have begun designing our wiping device, but to do so we needed to revamp our circuit to allow for some motors to drive the wiping action. We began printing many different versions of the above-board on our Voltera printer (thanks Voltera for finally giving us our consumables), but there were a hole bunch of issues...including that the holes and pads were not optimised for our Voltera. So, we spent the day designing a new circuit that now looks like...
More to come from Miao in the next few days...
19th November 2019
This is Miao's turn for updating the process.
Based on Dave's experience, we started to do the calibration of the sensor.
Now we don't want to use a deep cylinder for testing, as the glass cylinder is transparent, we designed a black box and printed it by our 3D printer. The box is designed to fit our sensor and it is 100% infill. Before we use the 100% infill black box, we have also done a waterproof test of the box. We fill some water in the box, and put the box on a piece of tissue, after 4 hours, we found that there is no water on the tissue. So it can be proved that the box should be waterproof.
Also, Dave printed another sensor case, which is smaller than the previous one and it has bulgy edges, so it is easier to glue epoxy on the surface of the LED and PT.
So now we have two sensors, the big one which Dave used for testing and a small one with bulgy edges.
After we wired the LED and PT for the small sensor, we tested that, it works and the analogue reading is more than 400 in air. However, when we cover the epoxy piece on the surface, the reading number became 0 or a quite small number(less than 10). Now we use liquid epoxy to glue the epoxy piece on the sensor box, and we need to wait until the epoxy drys and then we will test it in water to see if it has any difference.
To be continued……
20th November 2019
The liquid epoxy is dry and we put the sensor in DI water in the black box, the reading number changed to around 920, and when we get it out in the air, the number changed to 12.
Anyway, as it can be used for testing in water, we started dosing the solution for testing.
We use DI water(0.18NTU) and another lab solution(807NTU) to dose the solution, we change the testing solution's turbidity by adding more 807NTU solution into DI water and then record the analogue reading.
Solution with different turbidity was tested, the range of the turbidity is between 0.18NTU and 807NTU. The step of the testing solution is different in different turbidity range. From 0.18 to 50 NTU, the step is 5NTU, and the step changes to 10NTU for the solution between 50-100NTU, from 100-200NTU, the step is 20 NTU, and from 200-1000NTU solution, the step is 100. Both the big sensor and small sensor are tested.
The results can be seen in the following diagram.
From the data, it can be seen the results is different from Dave's result. From 0.17 to 50NTU, the analogue readings are floating and do not have too much change, and from 60 to 300NTU, the outputs decrease in a narrow range, after that the reading number suddenly changed to a very small number. We also found that for both sensors, the output almost fits a straight line between 60 to 200NTU.
The difference between my results and Dave's may be caused by changing the solution container. We need to do more test and found the problems.
To be continued……
21th Novermber 2019
As the results of the small sensor and the large sensor are different, we tested the two sensors to compare them.
We put both sensors in air, the analogue reading of both sensors is about 12. However, when we put the small sensor in a black box(just in the air without touching the water), the reading is also around 12, and after touching water, the number changed to around 926. For the big sensor, when put it in the black box without touching water, the reading is around 800, and if it touches water, it becomes 926.
I think the large sensor's results are more make sense, as the results in air and in DI water do not have a large difference.
But, why the two sensors perform so different when staying in the black box without water? Another question is why readings become different after touching water?
For the first question, we guess the reason may be the distance between the epoxy and the LED and PT, or maybe the bulgy edges? Now we know that base on our setting, LED and PT are very sensitive about the distance between the epoxy cover and their surface. More work needs to do to figure out these problems.
To be continued……
23th Novermber 2019
Today we did two things:
1. We repeated Dave's experiment(use the big sensor to do the experiment in a cylinder), 2. Recalibration(use the big sensor for testing, more accurate as we use a real turbidity sensor to test the turbidity of each solution)
For the first experiment, we got a similar trend but a different result.
I think the reason we got a different result is that we cannot make all the configuration of the environment exactly as same as before, and the sensor is very sensitive to the configuration(the distance between the epoxy and PT) and the surrounding environment, as the epoxy we glued to the sensor case has changed, so it has a different result.
For the second experiment, we use the big sensor for recalibration, and all the solution are tested to double-check their turbidity before testing.
The results are different from previous experiments.
The output results are between 860 to 900 for the solution between 0 to 200NTU, and the analogue output keeps floating, it does not have a specific trend. Therefore, it is not easy to calibrate the result with an equation.
Another problem is when we get the analogue reading for each solution, the reading numbers always have a floating vibration, I think it is a problem of the circuit.
Now the setting of our sensor reports different results in the same configuration, so it is difficult to duplicate the past experiment. We are thinking to change the setting of our sensor(change the resistor or change the sensor case or add some parts)…………
Need to search for more information to develop our sensor……
27th November 2019
As we still cannot get satisfactory results, we want to start to repeat the experiment on the paper and see if we can get the similar results, then we will find the difference between their settings and our design, then figure out the problem.
We did not get the exact same Acrylic tube, so we use the Vinyl tube with inner diameter 19mm to instead, and then we use our 3D printer to print a house of the sensor. The house can hold the tube in the centre and set LED on the top of the house and the PT on the side, so the LED and the PT are perpendicular to each other.
After that, we use the Clear Liquid Epoxy to glue the tube, LED and the phototransistor in the sensor house, the Liquid Epoxy is fully waterproofed and 100% transparent. Now waiting for it dry and test it tomorrow……
28th November 2019
We do use the new sensor box for testing, the circuit is showed as following:
However, the resistor we use has changed, R1 is changed to 500ohm and R2 is 330k ohm. But by using these resistors, the results do not change too much as the solution changes. We have to change the circuit configuration.
The first thing we want to change is connecting the base to the ground. We think the base may perform as an amplifier, and it may affect the analogue reading of our sensor. To compare with the previous test, we increase the resistance of the base, so the resistor is changed to 6M ohm. Another thing is that we want to make the LED brighter, so we change the resistor connecting to the LED as 50ohm. Therefore, the circuit is like:
We put the new black sensor in the glass cylinder for testing, for accuracy, we test the turbidity of each solution before the test.
Then we got the result, it looks pretty much better than before, the result is the linear relationship between the output reading and the turbidity.
Now we sure that the resistor on the base has the critical effects, and we changed the resistor even larger(10M ohm), but the result is not as good as 6M ohm, as the reading in 1000NTU solution is about 1000, that's good, but the reading in air and in DI water is not 0, that's not what we want, so we need to try to find an optimal resistor later.
As we think we have found the critical factor, we just use the 6M ohm resistor on the base and then use the circuit to test the previous sensor(the red one with a piece of epoxy on the surface), we still put the red sensor in the black box, just as the same configuration as before, although the result is better than before, some results are still unreasonable, for example, in DI water, the analogue reading is 177 which is not 0. That means we still got some problem with our design, now we are thinking about how to change our sensor case and design. Also, the floating vibration problem still exists, we are planning to use our PCB printer to get a better board to get rid of this problem.
To be continued……
29th November 2019
As we still want to use the wiper, so the black sensor case we used yesterday should be changed. We are wondering if half of the case can still work. Therefore, we use our 3D printer to print half of our case which is a triangular case. We also use the Liquid Epoxy to glue tube on the case, both the whole tube and half tube are used for testing. The settings are shown as the picture below. Also, our new board is printed out by our PCB printer, just waiting for the sensor ready and then test them.
Just waiting for the Epoxy dry.
2nd December 2019
Now we have two new sensors, one is a triangular case with half tube and another one is a triangular case with a whole tube, now we are going to use these two sensors for testing.
Firstly, we still use the same circuit for testing, and when we found the analogue reading is small, we changed the resistor which connected to the base. From the past experience, we found the analogue reading is getting larger as the resistor connected to the base increases, so we used 20M ohm instead of 6M ohm on the base.
The results can be seen as the following:
For the case with the half tube:
From the result, it can be seen that the sensor with 6M ohm connecting base performs perfectly, and the results show a linear relationship between the output voltage and the turbidity. However, for the 20ohm sensor, it does not perform as good as the first one, so we won't use such a big resistor for our design.
For the case with the whole tube:
The sensor with a whole tube shows a similar result, as the 6M resistor is better than the 20M ohm resistor.
Another thing is that we have test the 3.3v input, and we found the sensor does work with 3.3v input voltage, however, we need to do change our design to optimize the circuit performance.
Although the sensor with half tube works not bad, we still want to use the flat surface, more tests need to be done to find a better way for a flat surface.
3rd December 2019
Now we need to think more and retest the previous experiment which using the flat sensor box.
Today we tested the performance of LED and the phototransistor with the different distance between the transparent epoxy and the parts. We use tape to make the LED and the phototransistor in a fix location, and then change the position of the transparent epoxy board.
From the photo above, each unit is 5mm, when we made the LED and phototransistor face to face, the analogue reading is around 760 which is the largest number. Then we start to fix them in a specific location, then change the epoxy's location. Firstly, we make the transparent epoxy board touch the LED and the PT, the analogue is 0, and then we slowly make the epoxy far away from the two parts, in a certain distance the reading number became larger, and kept increasing until the intersection point, at that point, the reading number is 760 which is the largest number. After that, as the distance kept increasing, the number became decreasing and then became 0. Those results mean that: 1. If the epoxy is as close as touching LED and the PT, the sensor does work; 2. If the solution is within a certain distance away from the surface of LED and the PT, the turbidity of the solution can be detected by the sensor 3. In a certain distance, the phototransistor cannot detect the reflected light from the LED, which means the sensor actually does not need a specific boundary condition, because the light cannot reach such far away distance.
From the results, we know that for the flat sensor box, we need to make the epoxy touch the LED and the PT, and this configuration makes the analogue reading is 0 in the air which means the setting of our previous design should be all right. Another thing is that we do not need a boundary condition in our design because the sensor can only detect the reflected light at a certain distance.
Now the transparent epoxy board we use is much clear than the epoxy we used before, the next step we need to use this board for further testing.
4th December 2019
Today we are planning to test the sensor with a flat surface, and the epoxy needs to be glued on the surface of the sensor box.
At first, we used 100% infill white box for testing. The distance between the two holes is 20mm(centre to centre).
At the beginning of the test, we just put the LED and the PT in the two holes to test if the analogue reading is 0 in the air. However, we found that the analogue reading is not 0 when the two little bulbs are in the holes, we took them out and found even they are perpendicular to each other, the reading is not 0. When we used the black box to hide the LED, the analogue reading is still not 0. We found that two problems cause this result, one is the light source of LED is not from the edge of the bulb but the inner part, so the light can penetrate the glass bulb and be detected by the PT. Another problem is that the white box is not light-proof, so the light from the LED can be transmitted from the white box and it can be detected by the phototransistor. That can also explain why the analogue reading is not 0 in the air for the previous test(by using the red sensor box).
Then we used the 100% infill black box to test if the light will transmit through, and we found that the light cannot be transmitted through the black box.
Therefore, to solve the problems, we determine to use our 3D printer to print the 100% infill black sensor box, and to get rid of the light transmitting from the internal part of the box, the sensor box is designed to have two tube at the back the two holes, the two tubes will cover the body of the two bulbs so that light can no longer transmit through the sensor box.
After we set up the sensor box, we glue the epoxy cover on the sensor box surface, and then start our test. The tested sensor is shown in the following photo:
In our test, when the sensor is exposed in air, the analogue reading is 0, and in DI water, it is also 0. It is a good result as it matches our hypothesis. However, when we put it in the solution with 200NTU, the analogue reading is about 10, and when we use 1000NTU solution for testing, the reading number is about 76, so the problem is that the reading number is too small for calibration.
We thought that the problem may be the PT is too deep in the box, so it can detect little light from the LED, next step we need to print another sensor box to make the PT more close to the surface.
To be continued……
5th December 2019
The first thing we need to do is make the tube at the back of the hole shorter, so the LED and the PT are closer to the surface and can touch the epoxy.
The sensor box we used yesterday is a black box with 20mm distance between two holes(centre to centre). Now we use a new sensor box with 14.3mm distance between two holes. We use 14.3mm distance because in the past experiment the tube diameter we used is 19mm, so the distance between the LED and the PT is about 14.3mm. So we test this distance to see the performance. The new case can be seen as the following photo:
And we also connect LED and the PT to the Arduino and found the analogue reading is 0 in air, and when we put the transparent epoxy on the surface, the reading number is also 0. That shows the sensor works well. Next step, we are going to print more sensor boxes with different distance between the holes, 12mm, 10mm and 8.5mm, and then test if the distance between LED and the PT will affect the performance, and then we will choose the best one and test in solution.
To be continued……
6th December 2019
Now we have a sensor box family! Sensor boxes with different distance between holes(8.5mm, 10mm, 12mm, 14.3mm). And we will use these boxes for testing.
Distance testing
We try to put the transparent epoxy board in front of the different boxes with different distance, and then see the analogue reading in different distance. The results showed that if the two holes are closed, the distance between the board and the sensor box to reach the maximum reading number is smaller. For example, for the 14.3mm distance box, when the board is 3mm away from the box, the reading number is 380, and the reading number changed to 650 at 4mm distance. However, for 8.5mm distance box, the reading number is 650 when the board is 1mm away from the box.
So, after the test, we found 14.3mm between the holes is too far away and 8.5mm is too close, so we choose 12mm box and 10mm box for testing.
Solution testing
We used 10mm distance box and 12mm distance box to get the analogue reading in the different solution. For the 10mm box, the readings are still 0 for the solution below 80NTU, and for the 1070NTU turbidity solution, the analogue reading is only 128. For the 12mm box, the number is even smaller, for 1070NTU turbidity is 48. That result cannot be used for analysis. We have also changed the base resistor from 6M ohm to 20M ohm, however, when the resistor is larger than 7M ohm, the reading number in air and DI water is no longer 0, that is not what we want.
We compared with the current design and the previous test design(with round tube in the box), the difference between these two designs is the transparent board, one is a flat board and another is a round tube, that means the LED and the PT have a certain angle between the board, but with the tube, they are perpendicular to the tube surface. So we want to have another test which makes the LED and the PT perpendicular to the epoxy board and see if it will get better.
New sensor box testing
We use our 3D printer to print a new sensor box which is shown below, this sensor box can also make the LED and the PT perpendicular to each other, and the epoxy board could also be glued on the surface of the box which makes the board perpendicular to the bulbs. And the distance between the two bulbs is 14.3mm which is as same as the previous testing box(with a round tube in the centre). Our hypothesis is that if this sensor works, that means the epoxy board should be set as perpendicular to the LED and the PT, so we can try to cut two small round epoxy board and set them into the two holes which are perpendicular to the two bulbs.
To be continued……
10th December 2019
Today we used the L shape sensor box for testing. When we started our test, we got a serious floating vibration problem. When the sensor is exposed in air, the analogue reading is not 0, the range is between 8 to 21, and the numbers keep changing.
To solve this problem, we try to change the resistor on the base and on the emitter. For the base, when we changed the resistor from 6M ohm to 4M ohm and then 1M ohm, the analogue reading number became smaller but still not 0, and the floating vibration problem still exists. We have also changed the PCB board to the breadboard, but the situation did not change. The resistor on the emitter has also changed, however the analogue reading did not change too much.
At last, we used a new LED and a new phototransistor which are soldered by new wire, this wire we used is thicker and more rigid than that we used before. After we changed that, the analogue reading in the air is constantly 0. However, when we face the PT to the lamp, in a certain angle, the reading increases.
Now we found that the floating vibration problem may be caused by the wire, and the lamp may emit light which can be detected by the phototransistor, and that problem may affect the results of our experiments.
In the following test, we still need to use a black box for solution container to avoid noise from the lamp or other light sources.
To be continued……
18th December 2019
New update for our turbidity sensor.
Now we need to continue testing the last sensor with L shape sensor box. This time, to avoid the noise from the breadboard, we would not connect the resistors in the breadboard, instead, we will solder the resistor on the pins. Apart from that, to get rid of the noise from the lamp or the laptop screen, the solution will be contained in a black box which is printed by our 3D printer, and the cap of the black box is also printed. That cap will cover the top of the box, only one small hole will sit on the cap to allow the cables to come out, with this configuration, the noise from the other light source will almost be eliminated.
Just wait for the 3D printer completing the printing task, and then we can use the case and the container for testing.
To be continued……
19th December 2019
All the facilities for testing are completed this morning, as usual, we still use the liquid epoxy to glue the plastic board on the sensor case, and then pouring the liquid epoxy at the back of the LED and the phototransistor so that the sensor is fully water-proof. When testing the sensor, the solution container will be covered by the cap. The testing facilities can be seen as the following pictures:
This time, the thick wire and the black container with a cap are used to avoid the noise. As a result, the analogue reading is much stable than before. When we put the sensor in the black box and covered with the cap, the analogue reading is constantly 0, and the reading number is also 0 in DI water, the floating vibration problem is almost disappeared.
By testing different solution, the results are shown in the table:
| Media(NTU) | Analogue reading |
|---|---|
| Air(in black box) | 0 |
| 0.18 | 0 |
| 62 | 0 |
| 82 | 0 |
| 165 | 26 |
| 432 | 198 |
| 600 | 220 |
| 1036 | 352 |
The problem is that the analogue reading number is too small for the solution below 100NTU(almost 0), so it is not suitable for stormwater monitoring.
The reason may be the light source is not strong enough, we need to change some settings to let the light source stronger. For example, the successful sensor insert the tube in the middle of the case and the tube can congregate the light as a concave lens, can we use concave lens on the top of the LED to get the light source together?
We will try to do this kind of thing.
To be continued……
20th January 2020
We got the new update of our turbidity sensor development.
Now we have done several tests: distance test, LED resistor test, and the PT base resistor test.
Now we are using our new turbidity sensor board, this board is small and easy to connect all the pins when testing, and the analogue reading output is also more stable than the breadboard, the following picture shows our new board.
To make sure the LED and the PT sit at the fix position, we used our 3D printer to print a rail and the LED and PT holder, the holder can move on the rail and stand at a fixed position, as the following figure shows.
For all the test we did this time, we just put the LED and the PT in the holders and change some factors(distance, resistors, type of LED) to see what factor affects the results most. By this configuration, the closest distance between the LED and the PT is 6mm, that means at 6mm distance, the edges of the holders touch each other. And for the circuit, the input voltage is 5V. This time we did not glue the epoxy on the holder.
Distance test
Experiment Description: To test which distance will affect the analogue reading of the LED and the PT. We use the 6 degrees angle LED(brought from digikey), and use 51ohm resistor connecting to the LED, for the phototransistor, connecting 1M ohm resistor on the emitter, and connecting 5M ohm resistor on the base. By changing the distance between the LED and the PT(centre to centre) in the air, and use the cardboard box to cover them(making dark environment and avoiding noise), then record the analogue readings to see what the closest distance can be used between them. The closest distance means when we put them in the air, the analogue reading should be 0. The results for this circuit configuration is in the table below:
| Distance(mm) | 6 | 7 | 8 | 9 | 10 |
| Analogue reading | 20 | 0 | 0 | 0 | 0 |
That means for this configuration, the closest distance should be 7mm(centre to centre).
LED resistor test
Experiment Description: As the last test shows when put the PT and the LED within 6mm distance, it has analogue reading. We just use this distance, and change the resistor on the LED, and then see how the analogue reading changes. We still use the 6 degrees angle LED, and the 1M ohm resistor on the emitter, 5M ohm resistor on the base.
The results are shown in the table below:
| LED resistor(ohm) | 10 | 20 | 50 | 100 | 200 |
| Analogue reading | 200 | 100 | 20 | 0 | 0 |
This result shows that in this configuration, if the resistance of the LED circuit decreases, the analogue readings increase, which also means that the LED is brighter. However, when we use 10 ohm resistor for the LED circuit, the resistor is super hot that even hand cannot touch it.
PT base resistor test
Experiment description: From the LED resistor test, the analogue reading in 10 ohm resistor is 200 which is a large number, so we just use the resistor as 10 ohm which will obviously show the changes of analogue reading when we change the base resistor. In this test, we change the base resistor from 2M ohm to 20M ohm, and the analogue reading also changes, the reuslts are shown in the following table.
| Base resistor(Mohm) | 2 | 5 | 7 | 10 | 20 |
| Analogue reading | 30 | 200 | 300 | 380 | 860 |
This result shows that as the base resistor increases, at the same configuration, the analogue readings increase, and we need to choose a right resistor to make the analogue reading is 0 in air within a certain distance between LED and the PT.
To be continued......
22 January 2020
LED number changing test
Experiment description: As we try to make the LED brighter, so we are thinking to add the number of LED, now we use two LEDs in the circuit, and the two LEDs are vertically set in a new LED holder. In the circuit, the resistor for the LEDs is 50 ohm, by changing the distance, record the analogue reading and compare with the results of the distance test.
| Distance(mm) | 6 | 7 | 8 | 9 | 10 |
| Analogue reading | 40 | 40 | 28 | 0 | 0 |
From the result, it can be seen that, with two LEDs, the analogue is doubled at 6mm distance and it also has readings at 7mm distance and 8mm distance, which means more LED will make the light source brighter. Next test, we will change the configuration for further test:1. make the LEDs horizontally beside each other 2. change the LED resistor to 10 ohm and see the performance.
Different LED test
Experiment description: Now we have four types of LEDs: LED with 6 degrees(from Digikey), LED with 15 degrees(from China), LED with 30 degrees(from China), LED with 60 degrees(from China). Now we need to test the impact by using different angles. This time we use 10 ohm resistor LED, 5M ohm resistor on base, 1M ohm resistor on emitter. The distance between the LED and the PT is 6mm. The result is shown below.
| LED Angle(degree) | 6 | 15 | 30 | 60 |
| Analogue reading | 200 | 120 | 250 | 950 |
From the result, we can see that, the LED from Digikey is different from the Chinese LEDs, for the Chinese LEDs, as the angle increases, the analogue reading also increases. To make the analogue reading large enough in the low turbidity solution, I think we need to choose a large angle LED for testing.
Next tests, we will try to test the different angles between the LED and the PT, NOT ONLY FOR 90 DEGREES BETWEEN THEM. And we also need to do tests in water to see how the sensors perform in water.
To be continued……
24th January 2020
We have repeated the PT base resistor test, this time we not only change the resistors connecting to the base, but also change the distance and the resistor on the LED. This time we make the distance at 6mm and 8mm, and the resistor on the LED are 10ohm and 50oh. And other configuration of the circuit did not change.
The results can be seen as the table below:
| Base Resistor(ohm) | 2M | 5M | 7M | 10M | 20M |
| 6mm distance 10ohm LED | 30 | 200 | 300 | 380 | 860 |
| 6mm distance 50ohm LED | 0 | 20 | 50 | 90 | 280 |
| 8mm distance 10ohm LED | 26 | 120 | 380 | 500 | 950 |
| 8mm distance 50ohm LED | 0 | 0 | 5 | 100 | 330 |
This result also shows that with the same configuration, if the distance is larger, the analogue reading is smaller, and in the same distance and resistor on base, if the resistor on the LED is larger, the analogue reading is smaller, and also the larger the resistor on the base, the larger the analogue reading it is.
I think the next step, we need to use two LEDs for testing as they may have larger analogue readings, maybe we should use 8mm as the distance, and try to do the experiment in the solution(maybe 200NTU solution), see how it will perform.
Will start the new experiment very soon.
4th February 2020
Today we are going to do the reflection test. We want to see what the analogue reading will be if we put some materials in front of the LED and the PT with different distance. Now we choose two kinds of materials, both of them have rough surface, one is the washing sponge and another is the face mask. Now the setting of the circuit is: the distance between the LED and the PT is 8mm, the resistor on the LED is 51ohm, and the resistor on the base is 5M ohm, the resistor connecting the emitter is 1M ohm. For the LED, we use 6 degree angle LED from the digi-key, the following figures shows the sponge and the face mask.
And the test results are shown below:
| Distance from the LED and the PT(mm) | 0 | 1 | 2 | 3 | 4 | 8 | 10 | 12 |
| Green sponge analogue reading | 1003 | 1003 | 1003 | 980 | 450 | 75 | 10 | 0 |
| Face mask analogue reading | 1003 | 1003 | 1003 | 990 | 639 | 34 | 0 | 0 |
In the test, we we take the analogue, we make sure that the LED and the PT are in a dark environment, and without the reflect material, the analogue reading is constantly 0.
10 February 2020
Now we think that the main problems for our turbidity sensor are two things:
1. When we use the epoxy board on the surface of the sensor box, the light would transmit from the board and it can be detected by the phototransistor, to solve this problem, we need to make the light polarized. And we can redesign the sensor box which adds a barrier in the middle of the two holes, if so, the light cannot transmit by the epoxy board. The new sensor box looks like the following picture:
2. After double-checking the mechanism of the existing turbidity sensors, it seems that all the light beam is a direct light beam without angle. Previously, the light from the LED is divergent light, and it may cause the phototransistor receives light from different directions, and maybe the floating vibration is also caused by this problem. To solve this problem, many designs use a lens in front of the LED to make the light concentrated, some designs also add a lens in front of the phototransistor as well. We try to design our new sensor box by adding a small hole in front of the LED, so the light from the LED may transmit from the little hole, maybe this light will be a direct light beam.
Now we are printing the new box by our 3D printer, after it completed, we may use the epoxy to glue a new board on the surface of the box, and then test them in the water, see what will happen.
To be continued......
13 February 2020
Until now, our turbidity sensor's analogue reading still got the fluctuation problem, sometimes the analogue reading fluctuates within a very big range, it is very difficult for us to get an accurate result. When doing an experiment, we found that the Arduino board and the LED is getting hot after a long-time work. So we thought the fluctuation problem may be caused by the unstable light source, as the Arduino and LED are getting hot, they are not in a normal working condition, if so, the LED may not emit the stable light. Therefore, we are planning to use another power supplier for the LED, to get rid of long-time working, we also use a relay in the LED circuit, the relay can make the LED work intermittently.
After we set up the circuit, we use the round hollow section turbidity sensor for testing, the sensor still got the fluctuation problem, so it seems that the problem is not caused by the unstable light from the LED.
We need to use other ways to solve this problem, to be continued……
14 February 2020
Now we still use the external power supply for the LED and looking for ways to solve the fluctuation problem. We tried to add a "pull up" function in our code to make the PT work better. After we upload our new program to the Arduino, the Analogue reading results are much more stable than those in the previous test. All the results fluctuate in a very narrow range which means we almost solve the fluctuation problem.
Now we use the round hollow section turbidity for testing, and the circuit we use is Dave's circuit, which has 2M ohm resistor on the collector and 1M ohm resistor on the base. In this test, we found that the analogue reading is too large for all the solution, for example, the reading number for DI water is about 990, and the reading number is about 900 in the 500NTU solution, that is difficult for us to analyse the results. We need to change some configurations to make the results perfect.
To be continued……
16 February 2020
We found that the analogue reading is very sensitive to the current of the LED, if we have a tiny change of the LED current, the analogue reading changes a lot. Therefore, we connect a multimeter to the circuit to measure the accurate current of the LED. Then we change the resistors on the base and collector. After we tested many times, we found that one configuration for the round hollow section turbidity sensor works very well, the results of different turbidity solution got a linear trend.
In this configuration, the resistor on the base is 4M ohm, and the resistor on the collector is 2M ohm, the current of the LED 0.1A. The result is shown in the following diagram:
Now we can use this configuration for more test, but first thing we need to do is repeat the test and make sure it is reproducible.
17 February 2020
Today we repeat yesterday's experiment. However somethings changed:
1. Today we make all the turbidity solution in the container, the container is a black box printed by our 3D printer and the black box can make sure the sensor will be in an absolutely dark environment; 2. We use our turbidity meter to test each solution to make their turbidity accurate; 3. In the first two tests, the current is 0.1A, however, the results are different, and the current always changed by itself, so in the third test, the current was changed to 0.13A and the results are better.
The following diagram shows the test results, the first two diagrams are results in 0.1A current, and the third one is under 0.13A current.
The following things need to be done are:
1. Keep repeating the hollow section experiment, and make sure this experiment is reproducible; 2. Try to use a flat case for testing.
To be continued……
19 February 2020
The experiment is tested every day to see if it can get the same result, the results for yesterday and today are shown below:
20 February 2020
Today we have done two things:
Repeat the previous experiment
The previous test had been repeated for one more time today, the configuration was as same as the previous test, use 2M ohm resistor on the collector, 4M ohm resistor on the base and use 0.13A current for the LED, the results are shown below:
This result is similar to the past two days' results, which means the experiment can be replicated.
Try to use the flat turbidity case for testing
As we replicate the experiment successfully, we try to use the falt turbidity case for testing. For the flat case, the distance between the two holes on the case is 19mm, and the epoxy board is about 1.5mm thickness, we use the glue gun to glue the transparent epoxy board on the case, and test the case in different turbidity solution. The circuit is as same as the circular case, the only difference is to the LED and the PT in a falt case. We test the falt one in different turbidity solution, the result is shown below.
Although the points look like a linear relationship. the differential rang is too small(from 995 to 1006), so the result is not good enough.
Now we want to try to change our settings of the circuit, we use a 500K potentiometer connecting on the collector, and then disconnected the base, then try to see the analogue reading. We found that, the analogue reading increases as the resistance increases. However the analogue reading for 500K ohm is still more than 70, so we changed the current of the LED to 0.25A, the reading numbers changed to 135 for the 500k resistance. So we changed the resistor to a larger one, 2M ohm resistor made the analogue reading 561 at 480NTU solution. The results can be seen in the following diagram:
However, if we only use the first 5 points for plotting, there was a better linear trend:
Now it looks better, but still have two problems:
1. 0.25A is too large for the LED, we need to adjust it; 2. The analogue reading in the air and in DI water is not 0, we need to try to change some settings to make it perfect.
We need to repeat the test later to see if this configuration can get the same result, and we also need to adjust the configurations to optimize the performance.
To be continued……
24 February 2020
For our turbidity sensor, today we have done two things:
Repeat the previous flat case experiment
We used the same configuration of the flat case experiment last week, 0.25A current, 2M ohm resistor on the collector, and the 1.5mm coverage. Today we record 10 analogue reading numbers for each solution and used the average number to plot the diagram.
This time, the trend is similar to the results last week, but the numbers are different. Today the reading numbers are smaller than those we recorded last week, but still form a linear relationship. We need to keep repeating the experiment every day to see if it can still get the same results. Today's results are shown below:
Change the distance between the two holes
As the 0.25A current is too large for the LED and this also consumes too much power, we want to change it to low current, but it will affect the analogue reading numbers, so we tested the new case with a closer distance between two holes. The distance between two holes is 14mm now. Firstly, we still use the 0.25A current and see how the reading numbers change, with this configuration, the analogue reading number increased for each solution. The results can be seen in the following diagram:
With these results, we still used the 14mm case but changed the current to 0.1A, the reading number for DI water changed to 28, but the analogue reading in 240NTU solution changed to 93, that number is too small, so the next step we try to change the resistor on the collector, or make the distance between two holes closer.
Another thing is that the PT can get better performance at the solution below 300NTU, we are thinking to use a photodiode in our sensor as well.
To be continued……
27 February 2020
Too busy these days, new update for our turbidity sensor.
Today we did several things:
Repeat the circular case turbidity sensor experiment
Today we repeated the circular sensor experiment, we did not change any configuration, all the settings are as same as before: 0.13A current for the LED, 4M ohm resistor on the base, 2M ohm resistor on the collector, we also take 10 analogue readings for each solution and calculate the average number of the analogue reading for plotting.
Today's results are higher than the previous results, and the points did not fit a linear relationship perfectly, R square for the points is 0.987, the results and diagram are shown below.
| Turbidity(NTU) | 1(DI water) | 46.8 | 76.5 | 178 | 479 |
| Analogue Reading | 1017 | 1007 | 984 | 743 | 47 |
we have checked all the connections and the circuit, there is no difference with the previous configuration, the difference may be caused by the unstable power supply of the LED, as the current of the LED can be measured by the multimeter, the current changed slightly during the experiment, that may be the reason of the difference.
Repeat the flat case turbidity sensor
We use the flat case with 19mm distance between two holes, also we connect 2M ohm resistor on the collector, the current for the LED is 0.25A, the thickness of the coverage is 1.5mm, we used the glue gun to glue it on the surface of the case. Similarly, we recorded ten readings numbers and calculate the average. This time, the results are similar to the results in the previous experiment. The diagram below shows the results:
test the different hole distance case
As 0.25A is too large for the LED and it also consumes too much energy, we need to change the current lower, now we use 0.1A current for the LED, and then make the two holes closer. Today we used 0.1A current for our LED and tested four different cases, the distance between the two holes of the four cases are 19mm, 14mm,12mm and 10mm respectively. Each case we tested different solution, and then compare their performance, and also see which one is the best for our sensor.
The results are shown in the following diagram:
From the diagram it can be seen that the results of all the cases followed a linear relationship, the closer the distance, the wider the range is. For example, for the 10mm distance case, the largest number is 744 for 1010NTU, and the smallest number is 68 for DI water, the 12mm distance performs similar to the 10mm distance case. The wider range works better for our monitoring. Next time, we can try to use 10mm case for further test.
Validate the middle barrier test
Last time we thought that it should be useful to add a barrier in the middle of the epoxy board, because the light may transmit by the epoxy board and affect the analogue reading. These days we were using two small pieces of epoxy board to cover the LED and the PT respectively, and use the glue gun to make a barrier in the middle. Today we did a test to validate the function of the middle barrier.
We use two 19mm distance flat case, one with a middle barrier, another one uses an entire epoxy board to cover the LED and the PT(without barrier), then tested them in different solution, compare the analogue readings.
The results are shown below:
| Turbidity(NTU) | 1010 | 479 | 240 | 178 | 76.5 | 46.8 | 1 |
| without middle barrier | 467 | 280 | 170 | 152 | 75 | 57 | 39 |
| with barrier | 396 | 262 | 162 | 132 | 72 | 53 | 29 |
From the results, the reading numbers for the case with barrier are smaller than that without middle barrier, although not too much difference but make sense. That may caused by the long distance between the two holes, 19mm distance is a little bit far for the LED and the PT, light could not transmit easily with this distance. However, this experiment shows that it is useful to add a barrier in the middle to prevent light transmitting through the transparent board.
Next step work:
1. Use 10mm distance case for further tests, change the resistors to make the reading number better;
2. Calibration for the sensor to see which range turbidity is best for the PT's performance;
3. Prepare the experiment for the photodiode(depends on the results of calibration).
To be continued……
2nd March 2020
Repeat the circular case test
Today we did the 5th repeat test of the circular turbidity sensor. This test roughly fit a linear relationship, but not as perfect as the previous experiment. The five times result can be seen in the following diagrams:
From the diagrams above, we can see the reading numbers are stable, but still have uncertainty.
Repeat the flat surface case with 19mm distance experiment
We used the 19mm distance flat case for testing, today's test is the 3rd time test, the test is similar to the circular test, the results of the three test are shown below.
It also has problems, for this case, the linear relationship only fit the turbidity solution between 0 to 250NTU, if we plot the curve including 480NTU result, the points do not fit a good linear line. The diagrams are shown below.
Test 12mm distance flat surface case
As we tested last time, the 12mm distance flat case and the 10mm distance flat case have a wider range of results, as the 10mm distance is too close, we used 12mm distance case for testing. The test we did today recorded ten reading numbers for each solution, and use the average to plot the curve.
The readings from 0 to 479NTU solution fit a perfect linear relationship(R square is 0.9981), if we plot the 1010NTU result on the curve, the curve did not fit the linear relationship perfectly, R square is 0.9889, still not bad. The following diagram shows the result:
3rd March 2020
Today we repeated the 12mm distance flat surface test.
Previously, we use the glue gun to form the middle barrier of the case, now we found the light may transmit throuth the glue gun material, so we change the middle barrier. Now we used the epoxy to glue the two pieces of epoxy cover on the case, and glue a piece of blue tack in the middle and then test the sensor. The following diagram shows the result:
Both of the reuslts form not bad linear relationship, but still have uncertainty, next step we need do two things: 1. repeat the test again and again to get as more results as possible, and then determine the uncertainty; 2. use a regulator to make the input voltage constant and then do the test.
To be continued……
4th March 2020
Today, we tested the middle barrier test again. Previously, we use the case which is 19mm distance between two holes, we thought it is too far away for the light to transmit, so we are not sure if the middle barrier can be used or not. Today we used the 12mm distance case for the test, one with middle barrier which is blue tack, and another one is a whole epoxy board on the surface, the two testing case can be seen in the following picture.
In this test, we tested the middle barrier case for two times, and tested the case without middle barrier once, each test we recorded 10 analogue reading numbers and used the average value for plotting. All the results showed a not bad linear relationship, especially for 0-500NTU turbidity solution. The results and diagrams are shown below.
The experiment results can be seen in the table below:
| Item | 1010NTU | 479NTU | 240NTU | 165NTU | 76.5NTU | 46.8NTU | 1NTU(DI water) |
| case without middle barrier | 839.8 | 432.3 | 268.6 | 203.4 | 107.5 | 75.9 | 32.5 |
| case with middle barrier 1st time | 620.9 | 365.5 | 212.1 | 161.6 | 84.3 | 57 | 35.5 |
| case with middle barrier 2nd time | 619.8 | 368.2 | 213.3 | 167.6 | 86 | 57.6 | 32.3 |
We can also see the plotting diagram:
From the results, it can be seen that the analogue range for without middle barrier case is larger than the other one, and the results also form a linear relationship, so the case without middle barrier works better.
In the following experiment, we will try to use the case without the middle barrier for further testing.
12th March 2020
In the past week, we used the flat case with a whole epoxy board to repeat the test. We want to know the uncertainty of the sensor. So we want to repeat the test several times, if the data is enough, we can use them to determine the relationship of the analogue reading and the turbidity, and also the uncertainty of the sensor.
For the configuration of the test: The distance between the two holes: 12mm The thickness of the epoxy board: 1.5mm Collector: 2M ohm resistor LED: 1.56v voltage and 0.1A current
Until now, we have repeated 21 tests. The results can be seen in the following table:
From the table, we can see that the R square is not bad, but the slope and the intercept varies a lot. We thought it is still the problem of the external power supplier of the LED. When we tested the sensor, the current of the LED always changes, we have to manually change the voltage to make the LED current 0.1A, but it still not stable enough. Sometimes the unstable voltage will affect the performance of the LED. We need to use a regulator to make the voltage constant.
When the LED has 0.1A current, the voltage for the DC power is 1.55V. So next step we will buy a 1.55 voltage regulator to make the voltage constant and stable, and then repeat our test.
14th March 2020
We got the 1.55v voltage regulator. And when we use the regulator in our circuit, the output voltage of the regulator is constantly 1.54V. The circuit of the LED can be seen as follows:
But when we test the circuit, the current of LED is only 0.07A, the voltage drop of the circuit is 1.4v not 1.54v. We think it may be the problem of the relay, so we did not connect the relay in the circuit, just connect the LED in the circuit, now the circuit is like the following diagram.
With this circuit, the voltage drop of the LED is also 1.4v, so the current of the LED is not 0.1A.
But the LED still works, as the voltage decrease, the analogue reading number became smaller, which means it still forms a kind of relationship, but the range of the analogue reading is narrow. For example, the analogue reading number of 1000NTU turbidity solution is around 660 but now it is only more than 420.
We are waiting for our new regulator to come, and before that, we will use this one for testing, and see what kind of relationship will it form.
16th March 2020
We start to test the sensor, today we did not use realy in the LED circuit, we keep the LED on, and the current of the LED is 0.07A. Each time after the test, we used the turbidity meter to test the turbidity of the solution in the solution to make the experiment more accurate. After 6 tests, the results can be seen as the table below:
These results are not bad, as the voltage regulator can output the constant voltage, the slop and the intersection of the line has less vibration. However, in the field, we still want to make the LED work intermittently, so next step, we will add the relay in our circuit and repeat the test.
17th March 2020
Today we used the relay in our LED circuit, and other things did not change. We have done 6 tests today, the results can be seen as follows:
Now the results are not bad, when the new regulator comes, we can use 0.1A to test the performance, if it still works well, we can use the regulator for our design.
The next step, we have several things to do: 1. Use our BoSL board for further testing; 2. Get motor work for wiper; 3. Design the PCB for the sensor.
18th March 2020
After fieldwork today, we repeated two times of the experiment in the afternoon, the results can be seen as follows:
19th March 2020
Today, we change a little bit of the LED circuit, we put the relay just before the LED and then still repeat the test for 14 times, now we have already repeated the test for 20 times. The summary results can be seen in the following diagram:
It can be seen that the slop is slightly different from the test before we change the relay. I think the problem does not come from changing the circuit, but from the connection of the breadboard. Although the result is different, there is no large vibration which is good. The next step I think we need to do is design the circuit and PCB board, and wait for the new regulator comes and do more tests.
24th March 2020
Today we designed the circuit of the board, we use the ATmega328P-AU as our controller, the circuit diagram can be seen as the following diagram, it has already been sent to Stephen for double-check, once it is confirmed, we can process to test it. Next step we need to design the case of the sensor with the motor.
26th March 2020
Today we did several things:
Test the breadboard Arduino
Now we have already set up a breadboard Arduino, base on this test, we are sure that the chip can be used on the PCB to control the turbidity sensor. This time, we did not upload the turbidity sensor code on the board, for testing purpose, we only use a simple blink code to make a LED blink. As it works successfully, we can use a similar thing later for testing.
Next step, we will only use this chip to control the turbidity sensor and see if the results will be the same.
Test the BosL board turbidity sensor
We connect the turbidity sensor on our BoSL board, just like the circuit diagram above, we use two digital pins and "HIGH" and "LOW" code to control on and off of the LED and the phototransistor, but we got the problem, as the digital pin of Arduino can output maximum 20mA current, however the current we need for our LED is 100mA, so this connection is not able to support the turbidity.
To ensure we still control on and off of the turbidity sensor, we need to change our design, the power of the LED circuit will be provided by 3.3v directly, but we need to use an NPN transistor to work as a switch, and then use the digital pin to control the whole circuit.
Change the design of the circuit
Due to the issue we talked above, we have to change our circuit, not only the LED diagram, but also the crystal, now we change the 16Mhz crystal to 8Mhz crystal. We also add some pins on the board.
27th March 2020
Test on BoSL board
Today we assembled all the parts on the BoSL board, as the circuit we used above, we used the NPN transistor to control the LED circuit, the circuit is connect directly to the 3.3v pin. Therefore, in this circuit, the LED and the phototransistor are all supplied by 3.3v.
The NPN transistor worked successfully, we can use "HIGH" and "LOW" code to control on and off of all the circuit. So in the following design, we can add NPN transistors for the final design.
We also tested the analogue reading, when we set the sensor in dark environment in air, the analogue reading is about 25, and in DI water, the analogue reading is around 6, to make the sensor face the table, the analogue reading number is supposed as the largest number which is more than 920, that results are not bad. We need to test them in more calibrated turbidity solution later.
Modify the circuit diagram
The circuit diagram is finalised, we have changed some parts of the diagram, also we set some pins for the motor and set NPN transistor to control that, a pull-up resistor is added for the reset button.
4th April 2020
After we designed the circuit diagram, we need to combine all the things on a PCB, so we need to design a PCB.
Change the circuit diagram
As we want to make the PCB as small as possible, so we need to make sure all the route goes wisely, and if so we changed the circuit diagram. However, we did not change any parts of the circuit, only change the pin connections to make the parts can easily connect to the ATmega microcontroller. The new circuit diagram can be seen as follows:
Design PCB
As we changed the circuit diagram, we can design the PCB. The dimension of our PCB is about 24mm*12mm which is a double-sided board, the distance between the LED and the phototransistor is 12mm. As we only need emitter and collector pin of the phototransistor, we deleted the base footprint of the PT. The PCB designed diagram can be seen as follows.
This design will send to our PCB supplier to print.
5th May 2020
After one month, finally, we got our turbidity PCB, the tiny PCB dimension is 24mm*12mm, the following picture shows the real turbidity PCB.
9th May 2020
In the past days, we tested the PCB, as we need to make the testing simple, we did not solder the LED and the PT on the board, instead we solar some pins on the board, and then connected the previous LED and PT to the PCB, and use the previous case to test the analogue reading.
When we put a barrier in front of the case surface, the analogue reading is 1023, which is the largest value. When we put the sensor in air(not in black box), the analogue reading is 55-70, that is a reasonable result which shows the PCB works well. The next step, we need to use place the PCB and the sensor in a proper case and test the analogue reading in solution.
Please wait for the new testing results.
To be continued......
14th May 2020
Some new updates for the turbidity PCB testing. The whole process is a little bit complicated.
Now we want to use the ethernet cable to connect the PCB, so I desolder the pins on the PCB and connect the Ethernet wires on the holes: TX, RX, restart, GND and 3.3V. It's a little bit hard to desolder the pins and solder the wires into the holes, and after doing that, we uploaded the program into the PCB, it is a very simple code to let the PCB scan 1s and turn off the LED and PT for 1s. So, on the serial monitor, we can see the analogue reading updates every 2 seconds. Even we did not plug the LED and the PT, there will be new analogue reading which is 0. it can be seen as the following diagram;
Before I soldered the LED and the PT on the board, I used the previous LED and PT(soldering on the wires) to test, it works well. Then I put all the parts on the board and solder them on, but after that, the analogy reading got problems. The serial monitor looks like this:
You can see the last line, the PCB stop working. I think it must be some problems when I desolder the pins, maybe the solder point affects the PCB routes, so I took a new PCB and solder all the wires on the pins, I did not desolder anything, it looks like this:
And after that, I also tested using the LED and PT(soldering on wires), they all work. Before solder the PT and LED on the PCB, I plug the PT on the holes, the analogue reading changes to 30-40, because it will detect the environmental light. But when I plug the LED on the board, the same problem occurred. There must be something wrong with the LED.
Now I have to test the performance of the LED. I connected the LED on the female-male jumper wire, and simply plug the jumper wire pins in the holes, it works, but when I connect the LED two legs on the hole, it stops working. And when I put the LED to the end on the PCB, it works, it looks like the following thing:
We thought it maybe because of the wires are not insulating, so we need to put heat shrink on the wires, after that, all the wires got heat shrink, the problem still there. We tried many times to change the position of the two LED legs, and we are sure that the two legs did not touch each other, but it still has the problem.
At last, we just use two jumper wires(without any pins) to connect the LED and the holes, and this method works. And when we shot the two jumper wires, it the same problem occurred.
So we thought there must be some problems with the two legs of LED and the PCB, and something internal made the LED short the whole circuit on the PCB. But we haven't find the problem.
Now we are thinking to just try to connect the jumper wires on the LED and PCB instead of directly connecting the two legs on the PCB.
To be continued........
16th May 2020
During the past two days, we tested the sensors for many times, the results showed that when we connected the LED legs to the PCB holes, the whole PCB stopped working. And the weird thing is LED soldered on the jumper wires can work on the PCB.
We are thinking that maybe the problem is because too much current passing through the LED when the LED legs touch the PCB. So we use another Arduino UNO to supply the power of the board. We connected 3.3v on the UNO board, and other pins(TX, RX, RESET, GND) still connecting to the BoSL board, also we connected the GND of UNO and BoSL boards to make they have the same GND.
After that, we put LED in the PCB holes, it was working.
That means our hypothesis is right, the LED needs too much current and lets the BoSL board stop working. So we need to change the current of the LED. We tried to connect some resistor on the LED to see if it works. When we connected 100ohm resistor, it worked. And we need to try more smaller resistors to see which is the minimum value to keep the PCB working. From 100ohm to 1ohm, even 1ohm resistor can make the PCB working. But when we tried to use a 0ohm resistor, it did not work. So still the problem, why jumper wire work but 0ohm resistor did not work. We used the multimeter to measure the resistance of the jumper wire, we found the resistance of the jumper wire is 0.1ohm. So that means, the LED needs some resistance connecting to the holes, we cannot connect it directly to the PCB.
So we just solder a 1ohm resistor on the LED, and then solder it on the PCB. It can be seen like this:
And it was working.
Then we equip them in the case and did a quick testing, the sensor and results can be seen as following:
As R square is 0.9982 which is not bad, this PCB works well.
The following steps we need to do are: 1. redesign the sensor case, as we solder the resistor on the LED, so the current case is not big enough;
2. to make the sensor waterproof and the PCB is fixed in the case;
3. repeat the test in three different sensors to see the performance;
4. redesign the PCB, add a resistor on the LED route.
To be continued......
18th May 2020
Yesterday and today, we printed two new sensor cases and made two sensors, and then tested them in the real Turbidity solution.
Sensors Making
We designed two new sensor boxes, the new design allows the screws can be fixed inside the case. The new case and the lid can be seen like this:
Then we can place the sensor(PCB soldering LED and PT) in the case, and then seal the whole sensor in the case. There are two steps: 1. after placing the LED and the PT in the two holes, we inject some expoy into the case to make sure the LED and PT are fixed in the case; 2. after the epoxy became solid, we use a syringe to inject some silicone in the case(on the top of the epoxy) to make the whole sensor waterproof. We also need to ensure the wires are all in the silicone so that water won't goes inside the cable.
After about 30 mins, when the silicone becomes sticky, we need to put the lid on the case, and also use the glue gun to seal the lid and also glue a cove on the surface of the case. We also use a M8 cable gland on the back lid to make sure the cable does not move at all.
This design still has some drawbacks, we need to do some enhancement in the current design.
Test the sensor
Now we got two sensors, use the same method to test the performance of the two sensors.
The two sensors' results can be seen as follows:
The results of the two sensors are almost the same, however the results still have differences with the previous ones, maybe because we change the case.
We need to do more test for the two sensors to make sure they work well.
26 May 2020 Sensor Installation
Today we have installed the two turbidity sensors in Troups Creek Wetland, one at the inlet and another at the weir near the outlet. We also installed two greenspan turbidity sensor in the same position to compare the results.
Inlet installation
The inlet low-cost sensor was installed by fixing it on a piece of rectangular hollow section steel, and then fixed the steel on the sidewall. The low-cost sensor is facing the downstream of the water flow to protect the surface of the sensor. The BoSL board is put in a metal box and use a chain to fix on the sidewall to make it easy for maintenance. The data is transmitted to the website every 6 mins.
The Greenspan sensor is put in a piece of PVC pipe, and the pipe is fixed on the bottom of the creek, the Greenspan sensor is also facing the downstream of the water flow. The data is collected and saved in the data logger, the datalogger is in a cabinet on the bank, the cable of the Greenspan sensor is fixed and protected on the bed of the creek.
The distance between the two sensors is less than 60cm.
Outlet installation
The Outlet Greenspan sensor is also fixed in a PVC pipe, and the pipe is fixed on the weir, the depth of the Greenspan sensor is about 20cm. The low-cost sensor is fixing on the pipe, both the BoSL board and the data logger is stored in the outlet cabinet. Same as the inlet sensor, the low-cost sensor will upload data each 6 mins.
1 June 2020
Sensor data on installation day
After we installing the sensors, we checked the sensor value, in the afternoon, the inlet value is about 600, which means the turbidity should be around 550NTU, and the outlet value is about 1010 in the afternoon, which indicating the turbidity is about 900NTU, but the Greenspan sensor value at the inlet and outlet is around 15NTU and 70NTU respectively. We thought that maybe because the sunlight will affect the analogue reading of the low-cost turbidity sensor.
Data collection for the past three days
As we have monitored the turbidity for more than three days, for our hypothesis, if the difference is caused by sunlight, the analogue reading value should be fine at night. We can see the following diagram for the data:
From the diagram, it can be seen that at night the analogue reading of the low-cost sensors are stable and much lower than the daytime readings, that proves our hypothesis is right.
So the following step we need to design and print a cover of the sensor to get rid of the effects from the sunlight.
To be continued......
18th June 2020
Watch the following video to find out all about our first field trial of the all new BoSL Turbidity Probe. We are very excited!
19th June 2020
As the video shows, now we are facing the problem of sunlight impact and the biofilm, now we are trying to fix both of the problems.
Cover design and installation for the sensor
As mentioned in the video, now we have designed a new sensor cover on the sensor case to get rid of the sunlight, water will go through the case via its flowing direction, however, sunlight cannot penetrate into the case to affect the results. The sensor case is showing below:
With the help of this case, only a little sunlight can be detected by the phototransistor, we also changed the code to get the analogue reading for two times, one with LED and another one without LED, so we can get the background light by measuring the analogue reading without LED on, and then we can get the difference between the reading with LED and without LED, so the difference can be used for the turbidity analysis.
Calibration in the field
We also did the calibration in the field for both sensors, as the environment in the field and in the lab is different, so we need to do the calibration before cleaning the biofilm and after the biofilm. We have done the calibration for two times, the first time we did the calibration by turbidity solution between 50NTU to 450NTU, and the second calibration we used 3NTU TO 40NTU turbidity solution, and then we use the calibration curve to apply to the raw data, then do the comparison.
For the calibration method, we use a calibrated turbidity meter as a standard, use different solution to take the results from both Green Span sensor and the Low-cost sensor, at last, take the standard result from the turbidity meter.
21st June 2020 Data Comparison
After we calibrated the two sensors in the field, we applied the calibration equation to the two sensors' raw data, the comparison of the two sensors is shown in the following diagram:
The first comparison is from the cover installation day to the first calibration day, it can be seen after the calibration, the largest difference between the two sensors is 5 NTU, which is not bad;
For the data comparison between the first field calibration and the second field calibration, the correlation between the two sensors is much better, the two sensors' results are very similar which can be seen below:
So our method for the calibration is available for further comparison, we may do this calibrated work in the future.
28th June 2020 second Data Comparison
We collect the data in the past week for comparison, so the calibration equation we used for the two sensors is not simply using the trendline, we use the trendline to set the intersection of the two sensors, and use the turbidity meter data and the two sensor data difference, set the minimum value to solve the slope, and use the slope and the intersection to form a calibration linear curve. As each time we need to do the calibration for both before cleaning and after cleaning, the curve is different before and after cleaning. We may use last time after cleaning curve and this time before cleaning curve for the past one week's data calibration. As they are different, we use a linear relationship to indicate the changing and then determine the corresponding parameter for each single logging time, and plot the curve for the calibration. By using this method, we can get the following comparison diagram:
Currently, we still get some differences between the two sensors, will do some further monitoring and calibration to make sure we can get more accurate results.
8th July 2020 Third Data Comparison
We collected the monitoring data after 10 days from the last maintenance, from the Melbourne water rainfall data, there were slight rainfall events(0.2mm-0.4mm) on 28th and 30th, the low-cost sensor did not have too much change on these days, the Green Span sensor had big variations on 4th of July, but there are also more NAN values on the rainfall days, our hypothesis is the big variations are caused by the algae. Troups Creek area had a big rainfall event on 4th of July, it can be seen obviously seen that the turbidity value has increased on that day, and the changing pattern for both sensors are similar. From 6th of July, the low-cost sensor started to have big variations, that may be caused by the biofilm on the surface, as we mentioned before, the regular maintenance period is 7 days, so after one week from the last maintenance, the variation is big.
The data comparison can be seen in the following diagram:
15th July 2020 Fourth Data Comparison
We did the weekly calibration as usual, it was 7 days since the last calibration, and from the data this time, we did not see too much big variation for both of the sensors, the data of the two sensors are close to each other. The data comparison of this calibration can be seen as the following diagram:
24th July 2020
We will introduce some exciting things today!
Data collection and sensor calibration
We did the sensor calibration at the Inlet as usual. As we are busy preparing the new sensors this week, so the calibration is two days later than one week. Unfortunately, when we arrived at the site, we found the Green Span sensor battery is disconnected, and we connected the wires, only 8 data can be collected, that means the battery disconnected shortly after we left, so we missed the one week Green Span data, and this week we cannot do the normal data comparison, we will make the comparison happen next week.
New sensor installation
This is the most exciting thing in the past week! We installed ten more sensors in the Troups Creek wetland.
The installation method is easy. First, we prepare all the sensors in the lab, we put our BoSL board in a small box which is perfectly fit the BoSL board and battery, the box will be fixed on one end of a 1.5m PVC pipe. Then we use our 3D printer to print a sensor holder and fix the turbidity sensor and All-in-one sensor on the PVC pipe, the location of the sensors are 30cm away from another end. The final thing we need to do is punch a star picket in the wetland and then slide down the PVC pipe on the star picket. Then we can see a pipe stand in the wetland with a small box on the top, it is a sensor which can monitor turbidity, EC, water temperature, air temperature, water depth and air pressure, the data of these parameters will be uploaded to the website every 6 mins.
In the lab, we prepared ten sensors and installed them today. The lab preparation can be seen as the following picture.
After sorting out all the preparation work, we bring the ten sensors to the wetland and then simply punch the start picket and slide the sensors on them. All the sensors were installed in 2 hours.
The installation process can be seen as the following pictures.
Now we have ten sensors along the wetland, the position of the sensors can be seen as the following diagram, we also measured the GPS coordinate when we installed them.
Now we can do long-term real-time monitoring in the wetland! The last picture for the bird, they have new standing points now!
29th July 2020
After we installed the sensors for 3 days, we found two of the sensors stopped logging, and before they stopped logging, the last logging data are all in normal, so the problem is not from the sensors, maybe the BoSL board got some problems, or simply battery dead.
We went to the wetland and checked the problematic sensors, we found the wire connections are good, and the batteries are both in good condition. However, in the early morning, we found a lot of small water drops inside the box, the water drops may come from the evaporation and condensation via the bottom hole. And we checked the data, the sensors stopped logging from early morning or later afternoon which is the right time for condensation.
We clean up the water drops and reconnect the battery, the problematic sensor started to work again. Then we use some sponge and foam to seal most of the bottom hole, we hope this will make less water in the box. It is clear that sponge and foam are not good enough to solve the problem, however, we cannot use silicon to completely seal the hole, as we still need gap for the rope and cable to move, now we are looking for some suitable cable gland which may efficiently prevent water goes into the box.
Also, as this kind of battery still needs a lot of work on connection, in the future, we may change another kind of battery which is more robust than the current ones, that will cause fewer problems.
1st August 2020
Sensor Maintenance
From the sensor installation last time, it was almost one week. As we need to do the turbidity sensor maintenance every week, now we came to the site to replace them. From now on, we won't do the sensor maintenance in the field, we may use another sensor to replace the old one, and take the old sensors to our lab for further calibration and maintenance. In order to make sure the biofilm won't dry during the sensor transportation, we may make the sensors stay in the water and then do the calibration before and after clean the surface.
Last time, we only installed ten sensors in the wetland, now we also changed the inlet and outlet sensors to the PVC pipe type, by using this method, we do not need to do the low-cost sensor calibration in the field, the only thing we need to do is the Green Span sensor calibration.
Now, there are 12 PVC pipe sensors along the wetland, as we changed the inlet sensor and outlet sensor to new ones, the distance between the new sensors and the Green Span senors are around 50cm.
Velocity Sensor Installation
To get more information from the wetland, we also installed the Low-cost velocity sensor along the wetland, three velocity sensors are installed in the wetland at site 8, site 5 and site 1 respectively. Then installation method is as same as the Turbidity sensor, using star picket and PCV pipe, the installed velocity is standing beside the turbidity sensor. There are two transducers on the velocity sensor surface which have to be facing the water flow.
Now the sensor location can be seen as the following diagram(Blue points indicate the velocity sensor):
Data comparison
After we did the calibration, we compared the data for both inlet and outlet monitoring. In the past week, no rainfall event happened at Troups catchment, so the turbidity data is more stable than before.
For Inlet comparison:
And for Outlet comparison
From the diagrams above, it is clear that for the outlet, the difference between the low-cost sensor and the Green Span sensor became larger over time, also there is a big jump for both sensors at the end of the monitoring period. The hypothesis for the large difference is the sediment problem, as more and more sediment will stay in the sensor cover, that sediment would make more reflection in the cover. At the end of the monitoring period, both sensors had a weird jump, we supposed that more biofilm was on the surface of the sensors, and that will significantly affect the monitoring results.
4th September 2020
Due to the COVID19 stage 4 restriction, we haven't done the fieldwork for more than one month, now we are preparing to do the fieldwork next week. Our past experience shows there are some problems in our monitoring system, for example, the battery connection is not stable, more moisture in the box, the turbidity sensitivity is low. This week we have done a lot of work to solve these problems which will make our monitoring system more robust.
Making more new sensors
Currently, most the sensors we are using in Troups are with low sensitivity, due to the PCB problem, we have to connect the LED on the motor pins instead of the original LED pins, that makes the sensors less sensitive than the good ones. Now we have got some more new sensors, to obtain more accurate monitoring data, we will replace all the low sensitive sensors from next week. Now we have already completed all the sensor making and calibration, they are ready to do any work in the wetland!
Update the box design
As we mentioned, there are some problems on the box, the main problem is the cable hole at the bottom of the box, the hole allows water evaporation and condensation happens in the box and makes high moisture in the box, although we use some sponge to seal the hole, it still cannot completely solve the problem. Now we have used a cable gland in the box to seal the gap of the hole, the cable gland can also fix the length of the cable in the box, so we can also get rid of using more cable ties in the box. Also, the rope goes through the cable gland, the cable gland makes the rope tight, we do not need a carabiner in the box. The last thing we changed is the battery, the new 3.3v battery is much better than the previous ones, it can also fit the box perfectly. Now, as fewer wires in the box, it looks much cleaner than before.
10th September 2020
Some updates for the Troups turbidity sensors:
Past available data analysis
In the past more than one month, we have collected some data in Troups wetland, before we do the maintenance again in the wetland, we analysed the available data. For the current sensors in the wetland, some of them stopped logging after we installed them for several days, and some of them keep logging until September, this section, we will show the data from 24th July to 7th August(two weeks since we first install them). For some sites, there is a gap in the monitoring period, that means the sensor stopped logging and we lost that period of data. The following picture shows the summary of monitoring data for each site.
Some points to explain these results:
- For each of the diagrams, orange points indicate the water depth(cm), the axis range is 0cm to 150cm, and the blue points indicate the turbidity(NTU), the axis range is 0NTU to 200NTU;
- No enough water depth data is collected after 1st August for SITE8 and INLET, so we can not see the water depth curve for these two sites;
- During the two weeks period, there was a 14.2mm rainfall event at 5th August, it can be seen the water depth and turbidity increment match this rainfall event;
- The inlet turbidity data had a significant jump at the beginning of the monitoring period, that may because some sand or litters stuck in the cover which caused the high results;
- The turbidity of SITE3 has a very big increase after a period of time, the problem may be caused by algae, as SITE3 is very shallow, the sensors are almost at the surface of the water, so more sunshine may increase the growth of the algae, when we do maintenance, we found this site has the most algae on the sensors;
- The depth of some sites(SITE5, 6,10) has the floating problem, this may caused by the BoSL air pressure sensor, we will fix this problem soon.
Sensor replace and maintenance
Finally, we went to the field to replace sensors, we haven't come here to replace sensors for around one month, most of the sensor stopped logging. Now we use our new sensors with enhanced sensor boxes, hopefully, it can solve the moisture problem.
We also checked the sensors in the field, after the long period time in the water, the covers of some sites contain a lot of algae, even some spiral shell(SITE3) on the turbidity sensor surface, that may cause the sensor to get higher results.
maintenance of velocity sensors
We checked the velocity sensors in the filed, one of them died because of the SIM module dead, this problem may be caused by the high moisture in the box, the others died because of the battery problems. To fix all the sensors and seal the sensor holes, we took all the velocity sensors back to the lab, and we will reinstall them after fixing all the problems.
18th September 2020
Today we have replaced the Troups sensor for weekly maintenance, we also calibrated all the old low-cost sensors and the GreenSpan sensors to do the data comparison, both the inlet data comparison and the outlet data comparison are listed below:
Inlet data comparison
The data we collected in the past week(2020/09/10 -- 2020/09/18) is presented in the following diagram, there were rainfall events at 13th, 17th of September:
Some comments for the Inlet Data Comparison diagram above:
- To make sure all the result points can be well presented in the diagram, the vertical axis range is set to 0-700NTU;
- For the low-cost sensor, there are big values in the results, our hypothesis is some litters stuck in the cover, and caused the big analogue readings, some analogue readings get the upper limit;
- For the GreenSpan sensor, it can be seen a lot of reading is 0, that means the GreenSpan sensor has "NAN" result which means the turbidity is too high and out of the monitoring range, this problem is caused by a large amount of alga on the surface of the sensor, as the daily temperature is getting hotter, the alga grows much quicker than winter, therefore, the GS sensor won't be able to get an accurate result.
Outlet data comparison
The outlet data results are shown below:
- It can be seen that both the green span sensor and the low-cost sensor monitored the rainfall event in the past week, the turbidity reached the peak during the those days;
- The turbidity trend of both sensors is similar in the past one week results;
- In the first three days, the differences between the two sensors are large while it was getting closer in the following days;
- GreenSpan sensor reported several "NAN" readings while the low-cost sensor kept working well;
In the future, we will change another cover of the Inlet sensor to make the inlet results better.
26th September 2020
This Thursday, we replaced the sensors in the wetland and did the calibration as usual, the inlet comparison and the outlet comparison can be seen as the following results:
Inlet results comparison
the following diagram shows the inlet results:
- The low-cost sensor results are not accurate, the high turbidity(almost more than 600) is impossible in the inlet, when we did the calibration, we found a field snail on the surface of the sensor, that is the main reason which caused the super high turbidity results;
- The green span sensor got some increases at early 22nd and 23rd of September, which matches the rainfall events at those days;
- As the low-cost sensor also has this problem in the past weeks, we have changed the cover which will prevent litters or snail get inside the cover, now we are looking forward to seeing the results in the following week.
Outlet results comparison
the following diagram shows the outlet results:
- From the diagram above, it can be seen the two sensors got similar results in the past week, at last a few days, the results had some differences and the maximum difference is less than 10NTU;
- The trend of the two sensors are the same, and both of the sensors monitored the turbidity changes during the rainfall events;
- For the GreenSpan sensor, it still has some problem as it presented some 'NAN' value which is 0NTU points in the diagram, however, the low-cost turbidity sensor does not have this problem.
12th October 2020
Sensor replacement and data comparison
As too busy in the past a few days, the sensors have stood in the wetland for more than two weeks, now we have replaced them and get them maintained in the lab, and the comparison of the sensors have also completed. The data we compared is between 24th September and 11th October, during this period, there are big rainfall evens at 26th(18mm), 27th(6.2mm), 30th(2.4mm) of September, and 9.8mm at 1st October, 9.4mm at 5th October, 9.8mm at 8th October and 16.6mm at 9th October respectively. The following diagrams show the data comparison between the Low-cost turbidity and the GreenSpan sensor.
Inlet results comparison
The following diagram shows the Inlet data comparison:
- As we changed the cover of the Low-cost sensor, now the low-cost sensor does not have the high reading problem, the presented data above shows a reasonable continuous turbidity result;
- From the results above, both the low-cost sensor and the GreenSpan sensor monitored the rainfall events, as the high turbidity matches the rainfall events;
- For the GreenSpan sensor, there are many scattered points and the "NAN" results presented on the diagram, these results may be caused by the alga in front of the prob, and that problem may significantly affect the monitoring results;
- From the Low-cost sensor results, some jump points can also be seen especially between 1st October and 3rd October, our hypothesis is, some litters or snails flowed into the cover, and the caused the high monitoring results;
- By comparing the two sensors, although two sensors(especially GreenSpan sensor) both have jump points results, we can also see the similar trend of the turbidity changing at Inlet.
Outlet results comparison
The diagram below shows the Outlet data comparison:
- By comparing the data from the two sensors, it can be seen the monitoring results are similar between each other;
- For both sensors, the trend of the turbidity matches most of the rainfall events, but still have some changes with unclear reasons;
- For the GreenSpan sensor, there is an increase at 7th October which only 1.4mm rainfall on that day, also, there is a big jump at 10th/11th October which almost no rainfall during that time;
- For the Low-cost sensor, there is a growing trend at 9th October(with 16.6mm rainfall), however, there is no obvious peak with a big rainfall event, the low-cost sensor almost missed the event;
- The GreenSpan sensor still reported many "NAN" results.
New testing sensor installation
During the past a few weeks, we found the calibration curve of the "before cleaning" and "after cleaning" are similar, especially for the sensor only installed for one week. To understand how long is the best time for lab calibration and maintenance, we placed two new sensors for testing.
The two sensors are placed at Site 1, beside the original sensor, test sensor 1 will stay there without any cleaning, and test sensor 2 will stay there only with cleaning each week, then we can see the data results to see if we can place the sensors longer than one week, so we may reduce the frequency of the maintenance. We will see the performance.
October 19th 2020
We have done the sensor maintenance and calibration for the past week, in the past week, there were rainfall events on 16th October(2.2mm) and 17th October(11.8mm), the comparison results can be seen below:
Inlet Data Comparison
- From the diagram above, it can be seen the monitoring results between the two sensors are similar before 19th October;
- The results of both sensors increased at 17th October which match the rainfall event;
- From late 18th, the GreenSpan sensor results increased significantly, that may caused by alga on the prob.
Outlet Data Comparison
- For the outlet data, the changing trend of the two sensors are similar;
- Both sensors reported some turbidity increments during dry weather days but the reason is not clear;
- The rainfall event on 17th caused the high turbidity at outlet which can be obviously seen on the diagram;
- There is a significant turbidity decrease after the rainfall event, the turbidity reaches around 15NTU;
- GreenSpan sensor still has some scattered points and "NAN" results with unclear reason.
October 30th 2020
Finally, we got some time to update the monitoring results(between 19th and 27th) at Troups Wetland.
Inlet Data Comaprison
- From the data above, it can be seen the trends of the two sensors are very similar, both of the sensors monitored the rainfall event at 24th;
- The GreenSpan sensor had a big jump at 22nd which may be caused by some surface coverage on the prob;
- Due to the calibration problem, we can see the results of the low-cost sensor is slightly lower than the GreenSpan sensor, especially at the low turbidity water, the results is too low after applying the calibration equation.
Outlet Data Comparion
- The outlet results from the two sensors are not good enough to make comparisons, as the GreenSpan wiper caused ragging issues which makes a lot of alga on the surface, so a large number of results are "NAN";
- For the results before mid-day of 21st, the results are similar for low-cost sensor and the GreenSpan sensor;
- The rigging may start from the mid-day of 21st as we can obviously see the data jumped much higher than usual.
The ragging of the alga is shown as the following picture:
November 6th 2020
We have replaced all the sensors on 6th November, the data comparison can be seen as below.
Inlet Data Comparison
In the past a few days, the turbidity at the Inlet is very low, as the calibration curve is plotted as a linear regression curve from 9 points, so the results of the low turbidity solution is even lower than the actual value, therefore, the results of the low-cost sensor are pretty low, in the future, we will get a better calibration curve for the monitoring results.
Outlet Data Comparison
In the first several days, the results of the Low-cost sensor and the Green Span sensor are very close, and they both monitored the rainfall event at 31st Novermber, we can see the turbidity at that day increased, however, after that, Green Span sensor started to have big jumping points, the hypothesis of the reason causing the bad results is the alga affects the results a lot. When we went to the field, still a lot of alga on the surface, although the wiper of the sensor cleans the surface, a large amount alga still on the sensor and very hard to get off. The main reason causing the poor monitoring results maybe the alga.
It is also a big challenge to avoid alga in the summertime, as the water level decreased during summer and the high temperature increases the growing rate of the alga, we may think about a way to get a better result from the Green Span sensor.
February 2nd 2021
Until now, we have installed the sensors in the Troups Creek Wetland for about 6 months, after the Christmas holiday, we have already collected all the sensors from Troups and start to do some data analysis.
First, we do some raw data comparison for the low-cost sensor and Green Span sensor at both Inlet and Outlet. The comparison includes the data during the past 3 months.
Inlet data comparison
From the diagram above, some information can be summarised:
- For some weeks, the Low-cost sensor and Green Span sensor results are close after calibration;
- Low-cost sensor results have jumped a lot for a few weeks, that may be caused by some litters stuck in the cover which makes the light reflects too much to the phototransistor;
- From December, Green Span sensor results show a lot of scattered points, some of the results show very high reading, that may be caused by some ragging problem, also, as the water is too shallow at Inlet, Green span sensor cannot fully submerged in the water, the prob may out of the water, that may also cause high readings.
- Green Span sensor presented a lot of 'NAN' results, which means the turbidity is too high and out of the monitoring range(0-400NTU), this problem may be caused by some litters or stones stay in front of the prob which makes the reading too high.
Outlet data comparison
For the outlet data:
- The Low-cost sensor and Green Span sensor results for some weeks match, the results are similar;
- For some weeks, although the results have big differences, they have similar pattern;
- From mid-December, Low-cost sensor results have a significant increase, that may because of more biofilm has grown on the sensor surface, as the temperature at those days is higher which will increase the growth rate;
- Ragging issue of the Green Span sensor caused a lot of 'NAN' results.
Data analysis for all the sites
After plotting the results for all the sites, the relationship between the Water Depth and Turbidity can be seen from the diagram below:
From the diagram, it can be seen:
- for most sites, the water depth has a positive correlation with the turbidity, that indicates rainfall events will cause the rise of turbidity;
- the turbidity at many sites increases at mid-December, which shows high temperature will cause more biofilm on the surface;
- Some sites present unusual high turbidity results which should be caused by biofilm, sediment or litters in the cover, for site 3, as the water level is too shallow, the low-cost turbidity may above the water, that may cause super high results.
- Due to connection problem, some depth data haven't been collected at some sites, that reports depth information '0'.
Future work
In the following weeks, some detailed data analysis will be done:
- Depth data should do some accurate calibration;
- Low-cost turbidity sensor data needs to be double-checked;
- Data quality code should be designed and applied to the turbidity data;
- Green Span sensor data should also be cleaned and compared with the Low-cost sensor data;
- Start to design biofilm detection for Turbidity sensor.
July 11th 2022
Data Validation and Timeseries data comparison
We finally got some time to validate the turbidity sensor data. Before the validation process, the low-quality data needs to be distinguished and cleaned. The decisions made were done according to a number of criteria based on the available information. The information can be related to i) the data itself, ii) the maintenance information, iii) the environment and any problems from the measurement process, or iv) a combination of these three elements. Based on the aforementioned information, criteria were designed to filter the valid data for further analysis:
- Criterion 1: senor monitoring status (in-water for monitoring or not). This test checks if the sensor stays in the water for monitoring tasks based on the water depth. The sensor should be fully submerged in the water to make sure the turbidity sensor could provide a reliable monitoring result. If the water is too shallow which is below the top surface of the turbidity sensor, the collected data can be identified as not valid.
- Criterion 2: Missing data. For battery issues, hardware or software issues, the data was not collected by the sensor, which means the data was missed at that timestamp. The missing data can be identified as not valid.
- Criterion 3: The monitoring turbidity is out of the reliable detection range. For the two sensors, after the calibration curves had been applied to the raw data, the calibrated turbidity should be within the reliable detection range. For the Greenspan turbidity sensor, the detection range is 0NTU – 400NTU. For the low-cost turbidity sensor, the solution of the lab calibration was up to 250NTU, therefore, the reliable detection range of the low-cost sensor is 0NTU – 250NTU. The calibrated turbidity which is not within the reliable detection range of the corresponding sensors can be identified as not valid.
- Criterion 4: Unreasonable data. If the turbidity data kept increasing or decreasing without any rational reason, that data can be identified as uncertain data.
- Criterion 5: Uncertain data with dirt on the probe. If dirt such as sediments, algae or snails were observed attaching on the surface of the sensor probe when doing maintenance, that may significantly affect the sensor reading. Since it is hard to know when the dirt started to attach on the sensor, the data collected during the monitoring period between the last maintenance and current maintenance was identified as uncertain data.
- Criterion 6: Duration after the last maintenance. If the sensor hadn’t been maintained for more than two weeks, the data collected which was longer than two weeks from the last maintenance was marked as uncertain data.
- Criterion 7: Erratic increase or decrease values. Sudden or erratic increase or decrease of values, or unrealistic gradients (according to physical processes and local environment and conditions) should be filtered. Page-Hinckley test was applied to the sensor data (Gama et al., 2013; Mouss et al., 2004) to filter the erratic increase or decrease data. Generally, by following the Page-Hinckley testing method, the absolute sum of the difference between the residue and the cumulative average is compared with a threshold, this threshold needs to set by an iteration process with the moving window together. For different sensors, the moving average and threshold need to be set differently. As the residue of the turbidity results forms a normal distribution, the percentage of the total removed data should be around 10%. With this criterion, a sensitivity matrix can be designed for each sensor to show how much data will be removed with different moving windows and thresholds, so the right pair of moving windows and thresholds can be selected.
Also, to understand the turbidity changes in the wetland, the wind speed data, water level and temperature was plotted together for comparison, the following graphs are showing the Timeseries data of the turbidity and other weather parameters.


Statistical analysis of the comparison between the two sensors
A comparison was made between the data from the two sensors, some statistical analyses were also needed to understand the correlation between the two sensors. To compare the correlation between the two sensors’ data, the monitoring results of both sensors were plotted in the same graph with different axis. The horizontal axis indicates the Greenspan sensor results while the vertical axis presents the low-cost sensor results. If the results from the two sensors were similar, they were plotted around the y=x centre line. Since the monitoring results of both sensors showed jumping issues, in order to mitigate the impacts of the scattered points, the hourly average data was used for the data comparison. Also, the correlation between the two sensors’ data was assessed, both the Pearson correlation test Spearman rank correlation test was applied to the collected data. If the monitoring results were identical, the results would form a perfect linear relationship, therefore, to assess the linear association between the two datasets, a Pearson test was applied. However, as both of the sensor results were not normally distributed, a Spearman test was conducted to statistically compare the difference between them.
From the Figure below, it can be seen that the orange line in the graph is the y=x centre line. For the inlet monitoring results, the slope of the trend line is 0.847 which indicates the data points are centralized around the centre line. There are some data points above the centre line which means our low-cost sensor shows higher turbidity than the Greenspan sensor. This can also be seen from the time series plot in Figure 6 - the low-cost sensor results show more scattered jumping points above the Greenspan results. For the entire valid data, spearman rank correlation results are shown in the table below. The correlation coefficient of the inlet results is 0.6629 which means a moderate correlation between the low-cost turbidity sensor and the Greenspan sensor, where the p-value of the spearman test is less than 0.01, which means the correlation between the two sensors’ data is statistically significant (Zar, 1972). For the outlet monitoring data, the slope of the trendline is 0.13 which means more data points are under the centre line, showing the Greenspan sensor results are higher than the low-cost sensor, this can be also observed from the time series data in the following Figure. Some of the data points are higher than the centre line, these points with high low-cost sensor results come from December, at that period, the low-cost sensor showed a continuously rising trend. From the statistical analysis results, the correlation coefficient of the outlet data is 0.49 which still shows a moderate correlation. However, the correlation coefficient of the outlet data is smaller than the inlet which indicates the correlation at the outlet is weaker than the inlet, that is because the monitoring condition at the outlet is more complex than at the inlet, as the water is deeper and less responsive to rainfall and big wind. The p-value of the spearman test is less than 0.01 as well, which also shows a statistically significant correlation.
Biofouling impact of the sensors
Biofilm is the prevailing microbial life which is likely to attach on the surface of a structure. It is the main cause of biofouling. After the sensors were deployed in the water for a period of time, biofilm accumulated on the surface of the probe which may have affected the sensor readings. Theoretically, the more biofilm on the probe, the higher reading will be presented as more light will be reflected by the biofilm. To assess the impact of the biofouling, the calibration information was compared. For each monitoring period, the after-cleaning calibration curve (cleaned sensor) and before-cleaning calibration curve (sensor potentially with biofilm) were compared. When doing the comparison, a different raw reading was set for the sensors to make their actual turbidity readings around the 25%, 50% and 75% percentile of the entire monitoring results. After applying the raw readings to the different calibration curves, the actual turbidity results were determined for both before-cleaning and after-cleaning conditions, then the relative difference was able to be calculated for further comparison.
R=(T_A-T_B)/T_A
Where R is the relative difference between ‘after cleaning turbidity’ and ‘before cleaning turbidity’. T_A is the ‘after-cleaning turbidity’ reading for one specific monitoring period, T_B is the ‘before-cleaning turbidity’ reading for one specific monitoring period. To assess the biofouling issue, the relationship between the relative difference of before-cleaning and after-cleaning readings and the in-water time should be compared to evaluate if the biofilm growth could affect the turbidity readings. The relative difference of the low-cost sensors and the Greenspan sensor were summarised, a Wilcoxon Rank Sum test was conducted to assess the difference between the low-cost turbidity sensor and Greenspan sensor for biofouling issues, where the acceptable p-value of the Wilcoxon Rank Sum test is 0.05.
The figure below shows the relative difference of different sensors for various monitoring period. The in-water time varies from 3 to 36 days. From the graph, it can be seen that as the turbidity increases, the relative difference decreases, and there is no obvious relationship can be seen between the relative difference and the sensor in-water time which means the both the low-cost turbidity sensor and Greenspan sensor are not affected by the biofouling issue.
Apart from the in-water time impact, the relative difference of low-cost sensor and Greenspan sensor in the two monitoring sites are summarized in Figure 8. From the box plot graph, it can be seen that the relative difference of all the sensors is distributed around 0, however the inlet low-cost sensors show bias especially in the low turbidity condition. The median of the inlet low-cost sensor’s relative difference is 11.6%, 5.6% and 2.7% for 25%, 50% and 75% percentile turbidity respectively. For other sensors, the median values are all around 0 (between -2% to 2%) with different turbidity condition. This result shows the inlet low-cost sensor presents higher readings after a period of time in-water monitoring. As both the low-cost turbidity sensor and the Greenspan sensor are monitoring at the same location, and they provided different results, which means the low-cost sensor show a higher uncertainty than the Greenspan sensor. The uncertainty may come from the monitoring condition of the sensors. For the low-cost sensor, sediment is easy to cumulate in the cover which cause higher reading after a period of deployment. However, the Greenspan sensor probe is facing downstream in the open channel, less dirt was attached on the sensor surface, which makes the sensor readings more stable and shows less uncertainty. That is also the reason of low-cost sensor is showing more variability than the Greenspan sensor. However, although the low-cost sensor is showing more variability than the Greenspan sensor, from the Wilcoxon Rank Sum test results (summarised in the following Table), the p-value of the test is provided in the table. A p-value of greater than 0.05 will reject the null hypothesis that the median of differences between the two kinds of sensor data equals to 0. it can be seen that the variations between the low-cost sensor and the Greenspan sensor at both inlet and outlet has no statistical difference, which means statistically, the two sensors are providing the same performance.
10/05/2023 Circuit upgrade
A new circuit was developed to remove the need for a sunlight cover. It uses a transimpedance amplifier to convert the current from a photodiode into a voltage. In theory this should produce a highly linear voltage that is in proportion to the light intensity. This subtraction of ambient background light can be done in software. (The following is not the exact circuit used.)
Notably this proposed circuit also contains a voltage-current regulator that precisely controls the current through the LEDs. This enables using a digital (or true analog pin) pin to input a voltage signal that is converted into a constant current. This is important as the IV curve of LEDs change in response to temperature, and thus a circuit that can dynamically react and keep current through the LEDs constant is important. However even precise current control LEDs' efficiency is still dependent on temperature. As temperature decreases, LEDs become more efficient at the same current. Thus a temperature sensor is needed to cancel the effects of LEDs changing efficiency. Note that there is an internal temperature sensor on the SAMD21.
The simulated performace shows a very fast settling time in the order of a few microseconds. This is important to minimising the on time of the LEDs which is the largest current drain in the circuit and to prevent thermal damage:
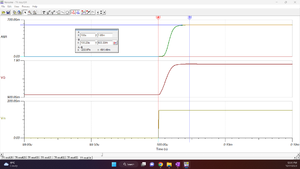
Note that no stability analysis in frequency domain was performed and the general reccomendation to ensure a phase margin of 45 degrees was ignored. (This turned out to not be a good idea as the chosen values of resistors/capacitors had large overshoot and needed to altered on the physical circuit).
The circuit was designed with speed in mind so that the On time of LEDs which draw a large amount of current is minimised.
Another feature is that it uses an analog mux to switch the gain of the transimpedance amplifier. This enables trading accuracy for dynamic measurement range and vice versa. This is more beneficial compared to using oversampling on the Arduino as it reduces noise and does increase the sampling time when doing analog read. This is also important to greatly minimising the on time of the LEDs which are the biggest power draw in the circuit.
With the opa4322, a shutdown pin is included. When shutdown is activated, the output of the op amp goes into high impedance. This is an important feature of the op amp as it can be used to properly turn off the voltage-current circuit and prevent any unnecessary leakage of current through the LED. As even when there is a LOW signal from a digital pin it not exactly a 0V signal.
And physically it looks like this:
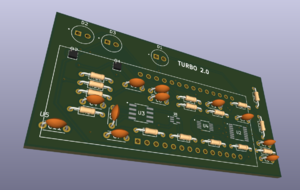
The test setup looks like this. A tube of various turbidity solution is inserted into a 3D printed "tube" that holds the photodiode and LEDs.
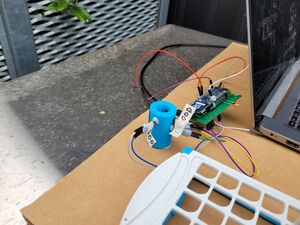
Unfortunately only basic stability analysis was done on the transimpedance amplifier and voltage-current circuits, thus the initial circuit had problems with signal overshoot etc. This meant soldering on additional capacitors and changing resistors values to get the circuit to behave best. The gains on the TIA was also altered to produce a better dynamic range that would not be saturated by sunlight.
For the voltage-current convertor, the dampening capacitor had to be doubled. Tripling this causes instablity, (online sources reccomend a series resistor at these high capacitance to help improve stability). The feedback resistance was also increased.
(I took a bunch of oscilloscope screenshots but did not bother to label or annotate them. So now I do not remember what is what...Here is one of the recent ones)
In the following, the pink trace represents the signal into the voltage-current converter. The yellow is the voltage drop of the resistor that sets relationship of I=V/R. The blue is the signal output voltage of the TIA at the analog pin. Note that each x-tick represents 1us and that the settling time is within microseconds.
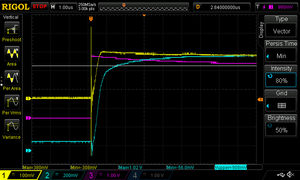
In another reading, the blue trace is now the voltage of VCC. Notice that there is a slight dip in the VCC pin when the LEDs are turned on. (This can affect the voltage reference etc).
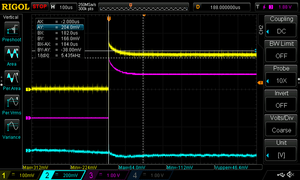
In the first experiment a 90 degree LED on the left and right was used. As expected this configuration of LEDs is non-linear at high turbidity solutions.
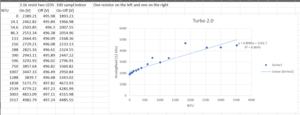
In all of the following experiments both LEDs were 90 degree on one side and the On-Off reading is presented. Note that different settings were used such as different gains, oversampling bits etc, this means the y-axis may not be comparable across the graphs.
On cloudy day in which clouds came and passed through:
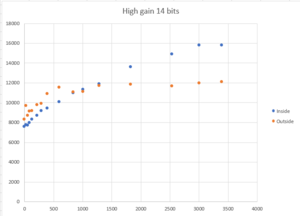
Notably the sunlight rejection seems to not be working at all as the outdoor vs indoor curves differ drastically. This was then repeated using a different gain setting. The same discrepancy was seen...
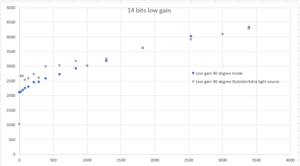
Note that in both of these graphs the cloud moved in and out.
Now the experimented was repeated but outdoor results were take in constant direct sunlight (without clouds).
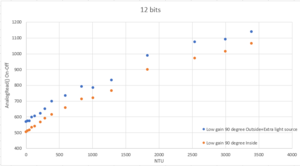
Unfortunately this shows that On-Off readings are not enough to remove ambient sunlight from the signal. However the results show that measurements are reproducible and accurate. Note the strong correlation between the two curves and that they seem to be seperated by some constant.
In order to better understand the relationship between incident light and voltage signal, the following experiment was devised. An external LED connected to an external wall connected current-source was used to simulate sunlight. Ancedotally the effects of LED heating could be noticed on measurement readings. Thus between readings the LEDs were left to cool for a few seconds.
The results of this is quiet interesting. Residuals show that there is some curving in both the On and Off readings. This is unexpected as the circuit was designed with linearity in mind (with simulations showing linearity).
A collection of all results is seen below:
File:Turbidity results.xlsx
24/10/2023 Version 1.0 Results
The curving issue with the old circuit has been fixed. It was discovered that due to the high-current burst of the LEDs, it was sagging down the voltage power rails. This caused the analog voltage reference that analog-to-digital converted (analogRead) relies on to sag as well and thus causing unexpected curving of results.
Hence this new circuit was designed to mitigate the effects of high-current bursts from the LED onto the ADC .
The schematic is here: File:Turbidity 10.pdf
Therefore a new custom PCB building and improving on the previous work was integrated into a small 5cm x 2cm form factor. This prototype version has the following improvements:
- Large amounts of decoupling capacitors to reduce the effects of voltage sagging from the high-current burst.
- High accuracy 12 bit ADC from TI (with 10.5 effective number of noise free bits).
- Carefully routing/placement to minimise the effects of noise.
- Temperature sensor accurate to 0.5C.
- Very low temperature coefficient components.
- Improved linearity (as foreseen by simulation results).
- Minimized power consumption
- On-board negative voltage generator producing -6.6V bias across the photodiode for maximised linearity response.
As a result of these improvements (especially the use of very low temperature coefficient components), the price per single board is ~$60. While this is a large increase in price from Mao's design it still pales in comparison to commerical sensors which are in the thousands.
However there are a few potential issues with this specific version:
- The large amount of decoupling capacitors means more leakage current. However the amount of leakage current depends heavily on the temperature. At 25C it is estimated (very roughly) that the leakage current is ~20uA. Then at 50C it is very roughly estimated to increase to ~300uA. Again these are only rough estimates! The need for many capacitors is also required to bypass the large amount of resistance on the power cables.
- The ADC like all SPI devices are active low on its slave select pin. This is problematic as the slave select pin is directly connected to an Arduino pin without any pull up and thus by default is always active. This consequently interferes with the bootloading of atmega328p due to the shared SPI lines.
- The ADC was incorrectly wired (with a power pin being incorrectly connected to ground. The schematic shows this issue being fixed) and thus could not be tested in this version. Attempts to try to do tricky soldering and properly connect it all failed.
- The 8Mhz crystal for the Arduino had its footprint incorrectly defined. Thus for the purposes of evaluating this prototype it was removed and the internal 8Mhz oscillator was used. No issues using the internal oscillator was observed. However it is known that having an external 8Mhz crystal makes UART much much reliable. And thus whilst it is possible to "get away" without one, it is strongly recommended to keep it.
A new version of the PCB was developed to address the above issues and will be shown in a later section below.
1. The following tests and discoveries related to this new board are shown below: Due to the much more sensitive nature of the circuitry even when using low temperature coefficient components, using a heat gun set at 70C is enough to cause a measureable distortion in the measurements. Unfortunately the effects of this temperature fluctutations was not recorded exactly. However it is believed that software temperature calibration will be mandatory to avoid the effect of temperature changes when in the field.
2. When taking the board outside and pointing it directly at the sun on a 26C degree day, it was discovered that the sun was capable of saturating the photodiode measurement circuit when using. Hence the gain of the measurement circuit was lowered by soldering on resistor in parallel to the photodiode feedback resistor to change the overall feedback resistance from 3K to 616 Ohms. This proved fruitful as when pointing it to directly into the sun, a voltage of 1100mV was measured using a multimeter. Converting this measurement into a photodiode current results in roughly: 1100mV/616Ohms=~1.8mA (Note this already accounts for the additional 100mV bias voltage on the op amp.). This value of 1.8mA then provides an estimate of the worst-case sunlight interference that occurs when the photodiode in pointed directly at the sun.
It is stressed however that this only occurs when the photodiode is very very closely pointed to the sun (within a few degrees). Furthermore from ancedotal experience of pointing that photodiode at the sun, there is a lot of variance in sunlight intensity. Specifically, on the day this testing was done, it featured very clear skies and no obstruction of sunlight. However upon returning an hr later to repeat this experiment, the measured sunlight intensity drastically decreased by ~60% again with no obstruction from clouds.
3. The photodiode light measuring circuit displays a shockingly unexpected amount of linearity and accuracy. As evidenced by the following videos where the LEDs are directly pointed at the photodiode and a large array of external IR LEDs is used to simulate strong sunlight interference. This is shown below. Note that due to the strong directionality of the photodiode, a large amount of light misses the photodiode.
In these tests the magnitude of the On-Off signal (which is measured as Vpp in the oscilloscope) always stays constant regardless of external interference. Note due to aforementioned issues of saturation, the value of the feedback resistance was reduced even further from 616 Ohms to 308.5 Ohms. Note that the LED was pulsed for 20us which is the hump in the middle. The left and right regions are when the LED is off. As seen a constant Vpp of 1.9V was maintained regardless how much artifical sunlight is shined. Examining the maximum voltage, this then translates into a photodiode current of (2.2V-0.1V)/308.5Ohms=7.2mA. Linearity with these large currents is not guranteed by any photodiode manufactures. For the SFH203FA used, it is only guranteed to be linear up to 50uA.
Given that linearity up to 7.2mA has been proven this, it significantly dwarfs the worst-case sunlight current of 1.8mA. This is promising as it means that even in high amounts of sunlight interference, linearity still holds.
4. The effects of noise within the measurement circuit was also measured seen below. Note that this is zoomed in on when the LED signal is ON:
Examining the variance (shown in the bottom right of the oscilloscope) it fluctuates from 250uV to 450uV. Taking the largest variance and converting it into standard deviation, sqrt(450uV)=~22uV. For a 99.7% confidence interval, this then becomes 22uV*3=±66uV or a range of 132uV. This is a very small amount of electrical noise, and this translates into 14.7 noise free number of bits. Working shown below:
Currently the ADC only has 10.5 effective number of bits. Thus it is strongly upgrading from that ADC to fully utilise those 14.7 bits of information.
23/02/2024 Version 2.1 Results
- ADC was upgraded to 16 bits (along with adding a 16 bit capable voltage reference).
The following is the calibration curves in 3 different enviroments: "inside", "outside synthetic (using LEDs to simulate sunlight)", "outside real". This was measured using a sample of 25.
Note:
- Due to the circuit design, there is an constant offset of ~1986 bits. This means a reading of 1986 actually correlates with a 0 reading on the photodiode.
- The outside synthetic test using LEDs had a stronger "sunlight" compared to real sunlight. i.e. The synthetic test had an average Off reading of ~4000 bits, whereas the outside test had an average Off reading of ~2400 bits. This then subsequently means: (4000-1986)=2014 bits of synthetic background sunlight vs the (2400-1986)=414 bits of background real sunlight. That is the synthetic test was exposed to 5x more sunlight.
- Only the first two "outside real" datapoints were collected as the sensor promptly broke afterwards due to bad wiring.
(Some of the standard deviation values are incorrectly absurdly large, not sure why but most likely due to a precision bug in the Arduino code.)
Shown above is the On-Off readings plotted in all 3 enviroments. As shown the calibration curves are all basically identical. The y-intercept for both equations was set to 0 since it essentially goes through the origin. Using the indoor's calibration curve: On-Off = 0.3335 * NTU, rearranging this then becomes NTU = 2.999 * (On-off). Hence each increment of On-off is worth approximately 3 NTU. Furthermore, taking the average SD(On-Off) of the valid datapoints it is about 5. Converting this, it then becomes 5*3=15 NTU standard deviation.
Now plotting the error in reading between "inside" and "outside synthetic" (using the formula: inside - outside synthetic). Again the Y-axis can be converted to NTU by multiplying it by 3. Hence the maximum sunlight error is: 2.76 * 3 = 8.3 NTU. Given that there is no particular pattern in that plot, it seems that it may really be experimental error.
Other points:
- The maximum value that the ADC can read is 2^16=65536 bits. Hence converting this into NTU, the maximum NTU reading of the sensor would then be: 65536*3=196608 NTU.
- Examining the "On" column within the table, the largest reading is 5010.36 bits which leaves a large amount of headroom for sunlight rejection. For reference, the ratio of the maximum ADC reading and the largest reading is (65536/5010.36)=13. Meaning that the sensor can tolerate up to 13 times the outside synthetic sunlight intensity.
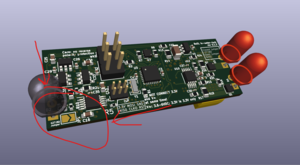 .
.- Included on the PCB is a jumper that can be soldered to toggle its alternate "high sunlight rejection but reduced accuracy mode". Meaning that the calibration conversion would then become: NTU = 30 * (On-off), essentially multiplying the NTU per (On-off) increment by 10x. This could in theory further increase the maximum sunlight rejection intensity to 130 times what was used in the outside synthetic sunlight intensity. Given that both outside tests have so much headroom for sunlight rejection, this mode was not tested.
- From other informal testing, it is noted that this "high sunlight rejection" mode is necessary to be able to point the sensor directly at the sun without it saturating the ADC. This is only achievable by deliberatly pointing the sensor within rougly a few degrees of where the sun is. This would then in theory increase the 15 NTU standard deviation to 10*15=150 NTU of standard deviation which would mean much more samples would have to be taken to compensate. However that is only a theoretical extrapolation and the standard deviation may be no where near that high in reality.
- Due to power constraints, the maximum sampling rate is about 4,500 Hz which is more than sufficient.
- When the sensor is completely dry, the On-off reading in air is 0 NTU. When the sensor has been dipped into water and then lifted out into the air it then reads (40*3)=120 NTU. This is due to a small amount of residual water sticking to around the bottom of the opening.
- The cost in PCB components for a single sensor is roughly $67 USD (using 1 unit pricing).
Lastly due to using two LEDs, it may be possible to implement biofilm detection by turning on only one LED at a time and observing whether there is a large discrepancy between the two measurements. This technique may be applicable to detecting when the sensor is submersed or in open air as in air only the bottom LED is covered by residual water.
15/03/2024 Current draw
The measured current when the circuit is active and taking measurements is 12.71mA and takes 80ms to do so. The sleep current is about 45uA. Taking a weighted average of current draw assuming a sample is taken every 6 minutes: (359920ms*45uA+80ms*12.71mA)/360000ms=48uA.
October 1st 2024 Turbidity, EC sensor version 1
The previous Turbidity sensor (with single LED and single PT) was updated in the past weeks. As the old turbidity sensor's in-air reading is not 0, it is hard to understand if the sensor reading is in-water turbidity reading or in-air reading. In this case, we have merge the EC sensor and the turbidity sensor to one sensor which is the Turbidity, EC sensor, and this design is version 1.
We simply added a screw terminal and a 100ohm resistor in the circuit and connecting to the AT-mega 328 chip, the schematic is shown below:
and the PCB has been updated, and the 3d render is shown below:
With connecting the screw terminal with two steel rod,, we can use this EC sensor to detect the water, if the reading is not 0, it means EC sensor is submerged in the water so the Turbidity sensor is in water as well, then we know the reading is the water turbidity reading.
Now the design file is sent to the manufacuturer for production and testing.
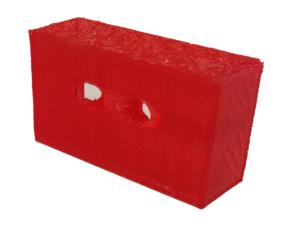
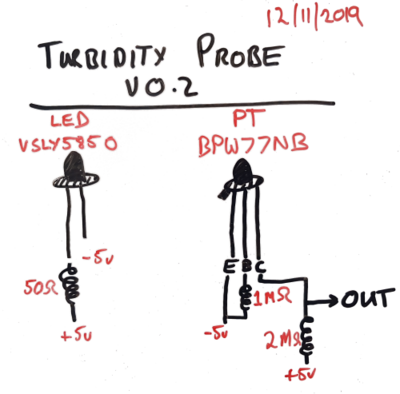
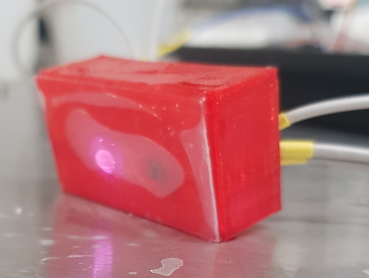
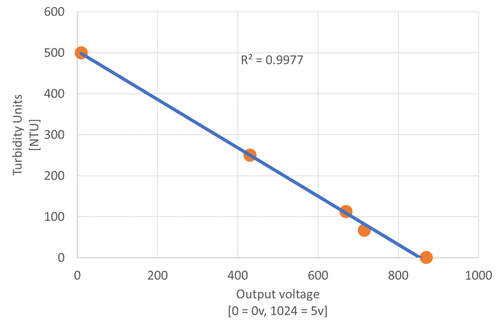
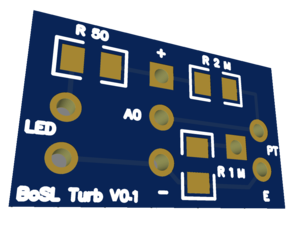
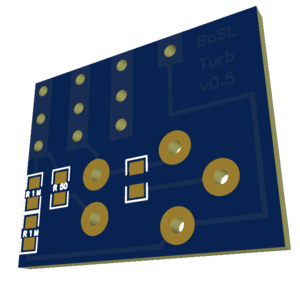
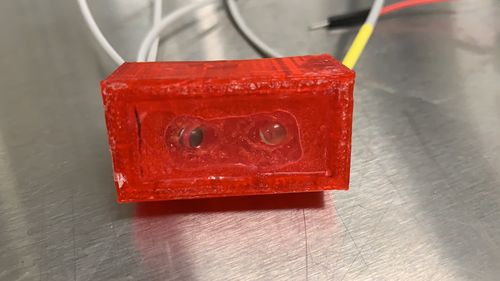
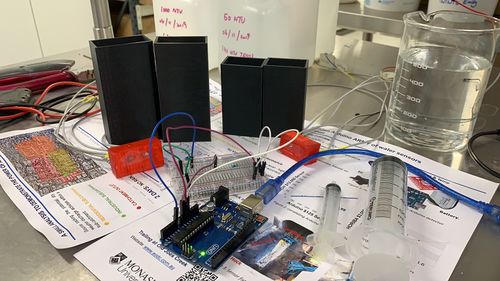


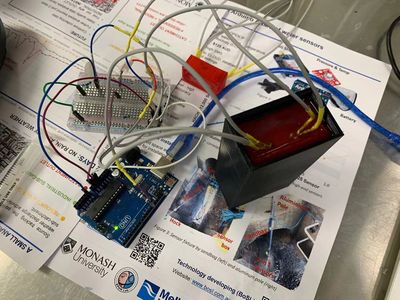
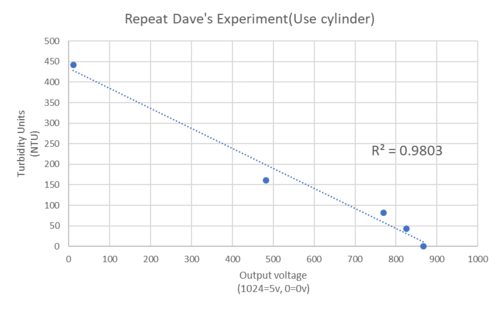
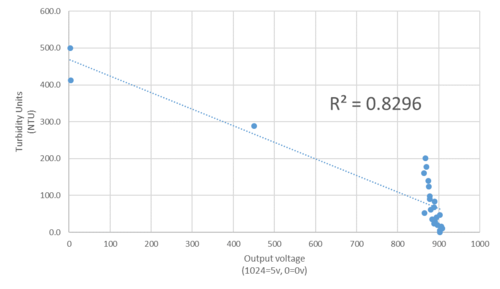


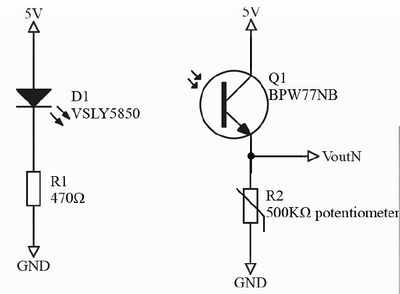
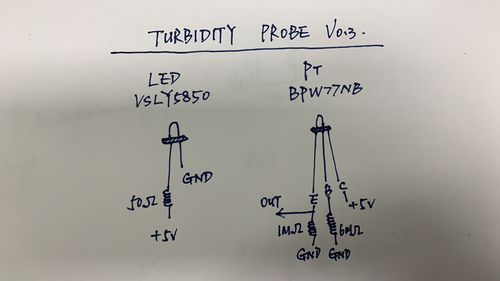


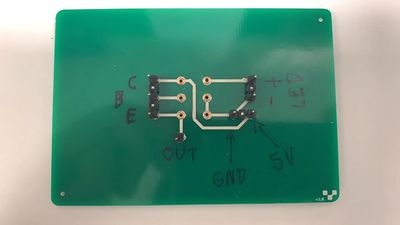


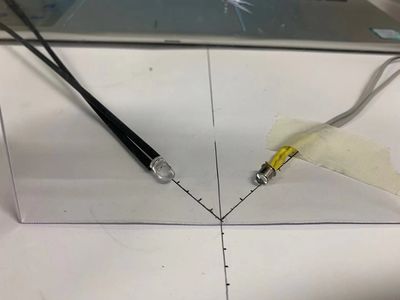


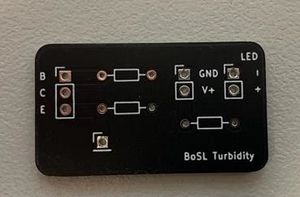
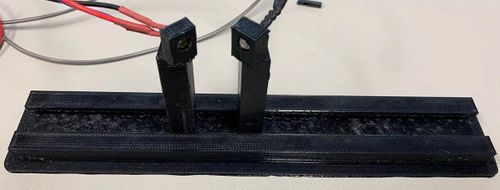
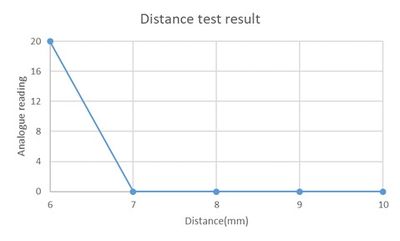


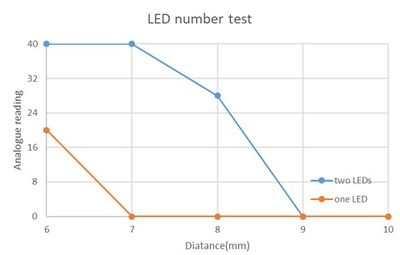
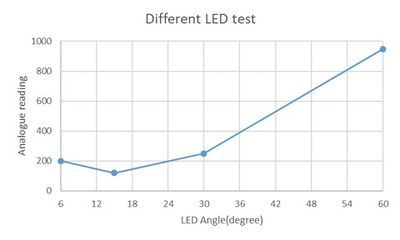
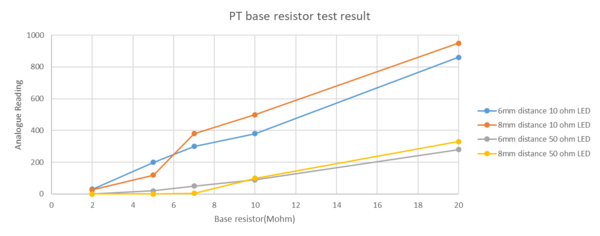

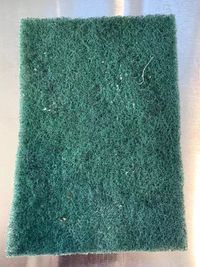


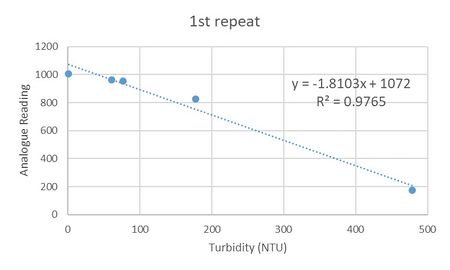
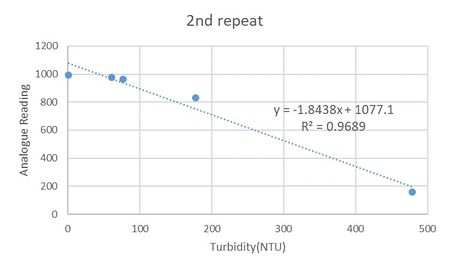
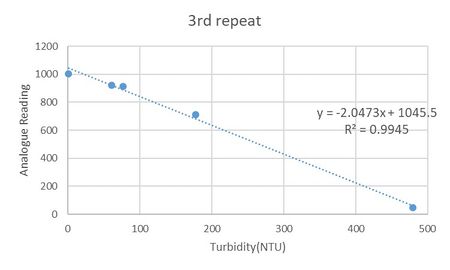
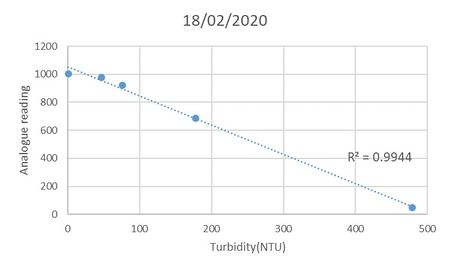
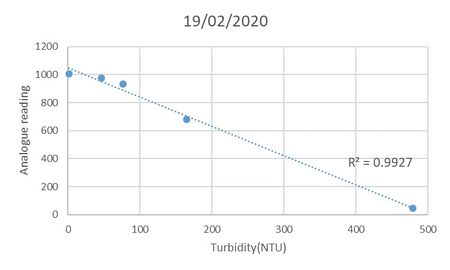
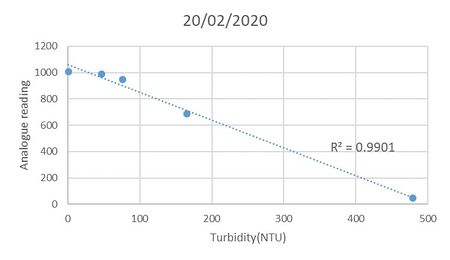
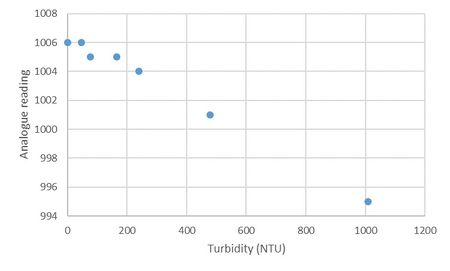
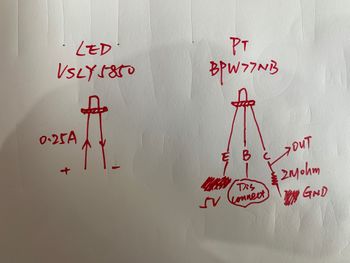
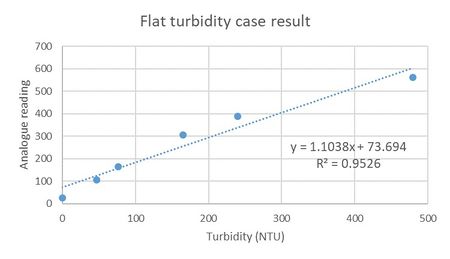
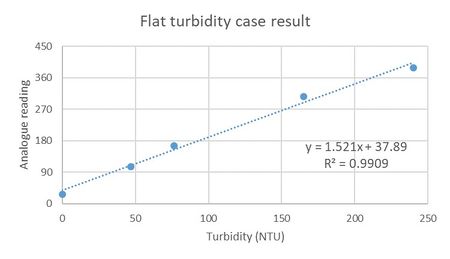
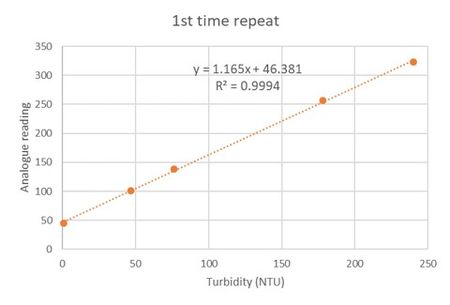
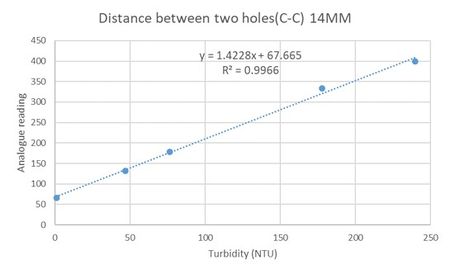
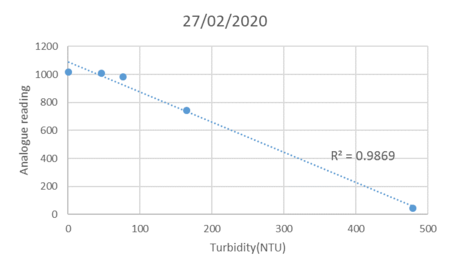
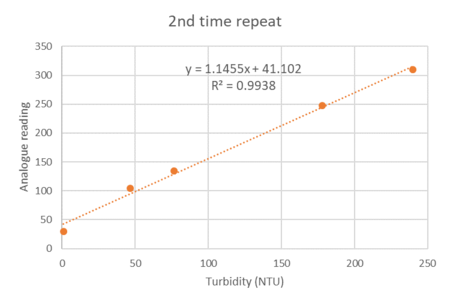

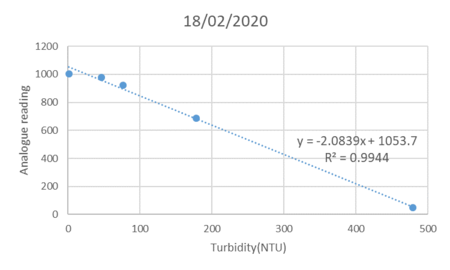
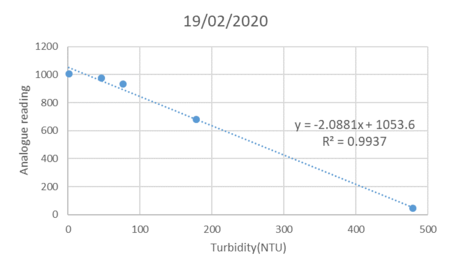
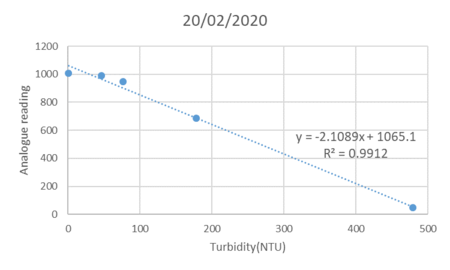
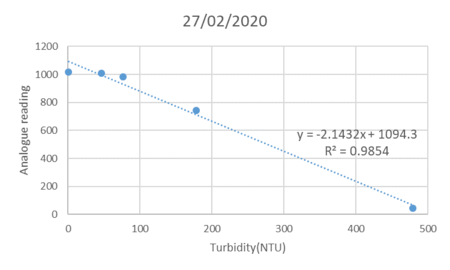
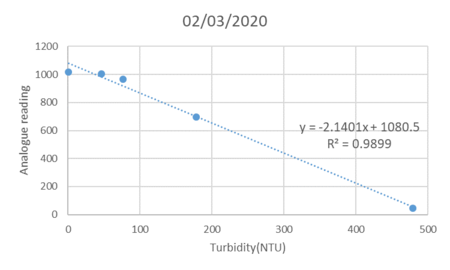
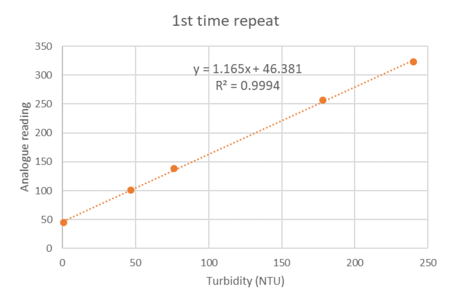
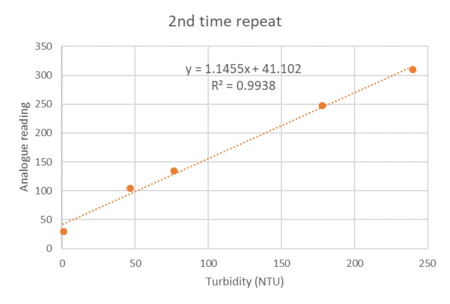
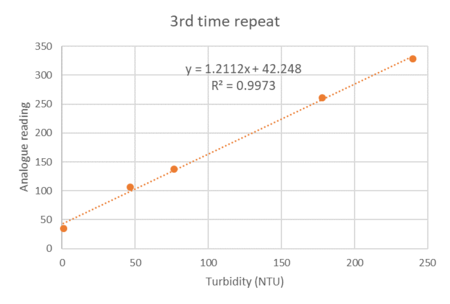


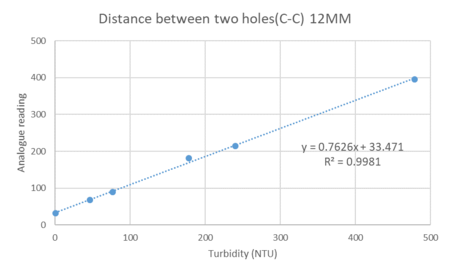

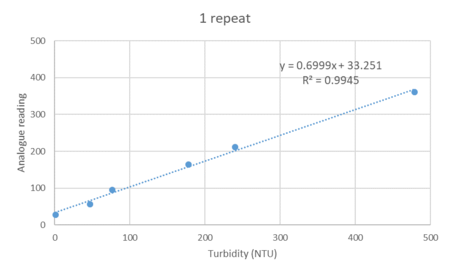


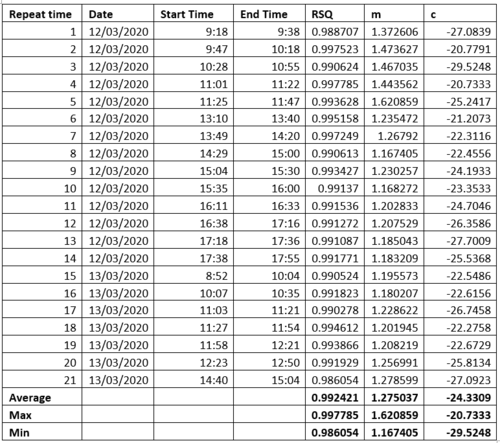


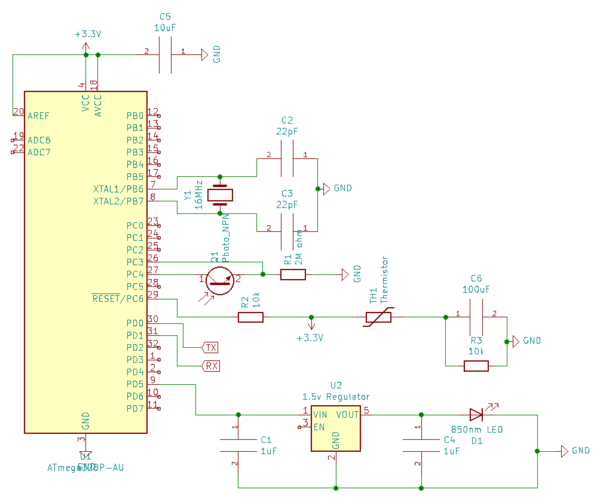
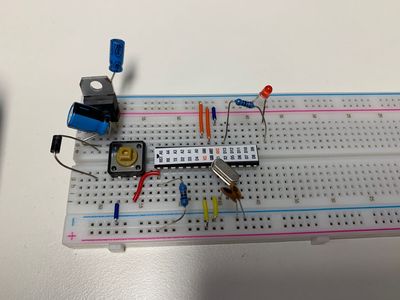
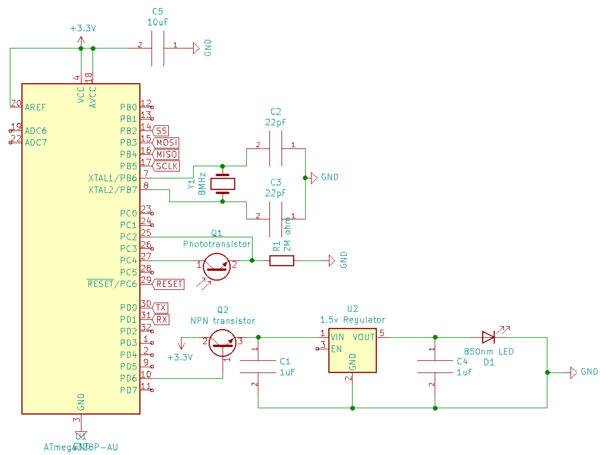
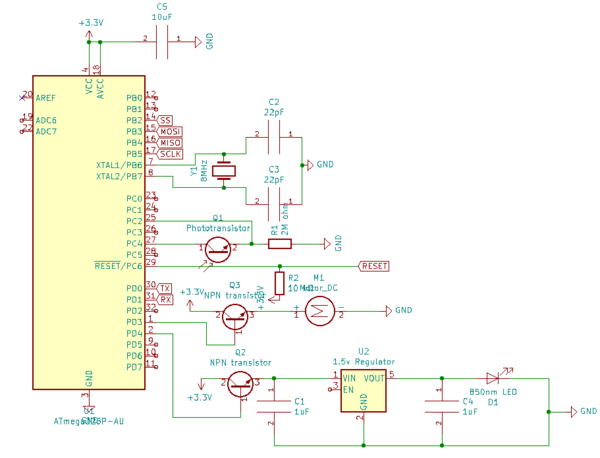
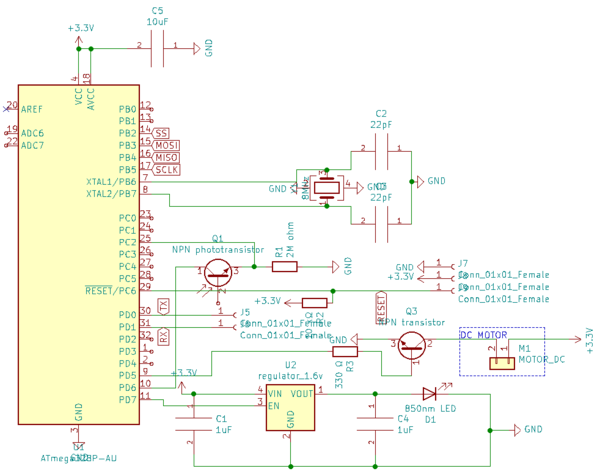


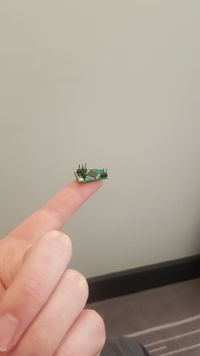
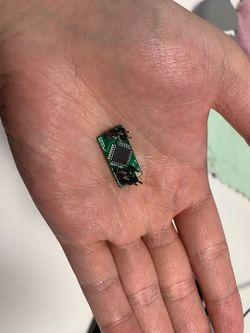
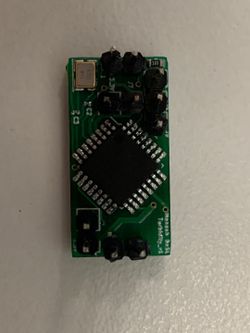
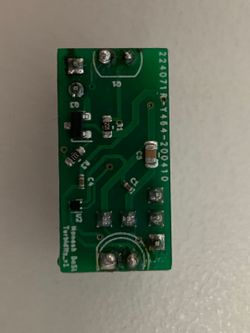
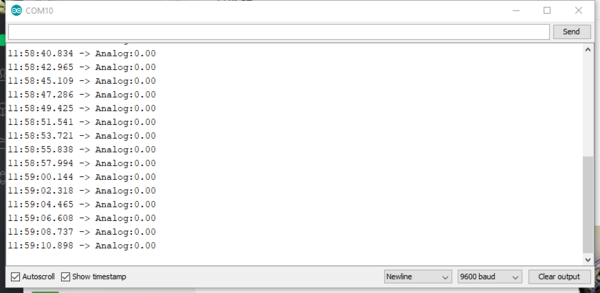
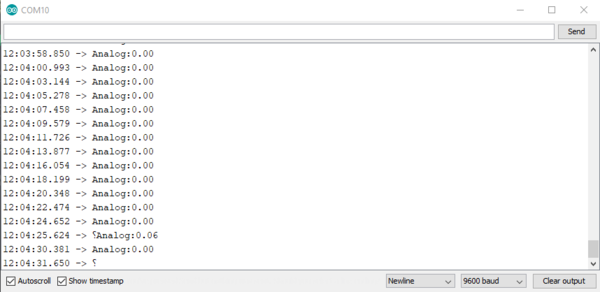
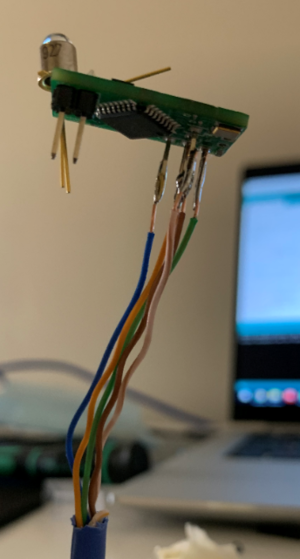
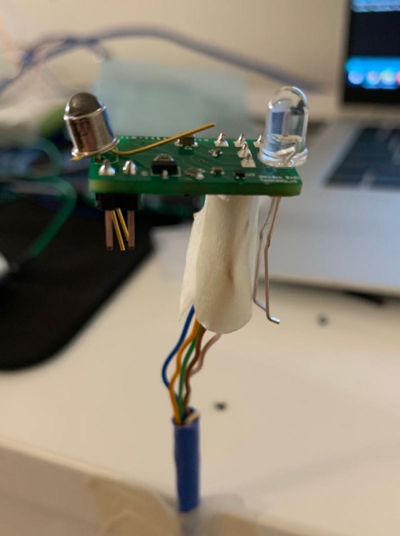


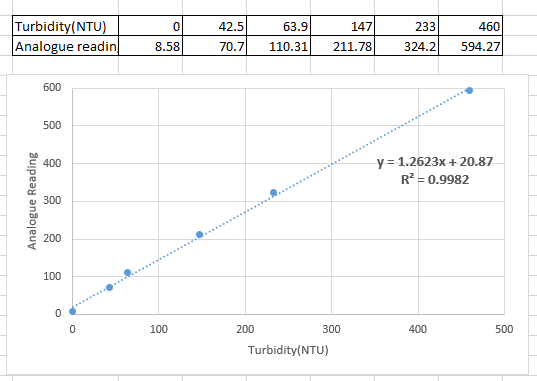
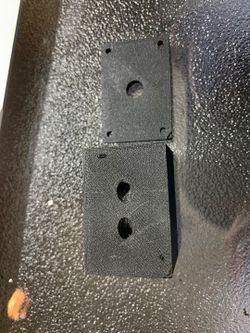
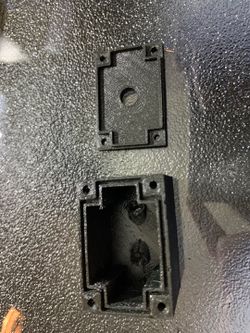
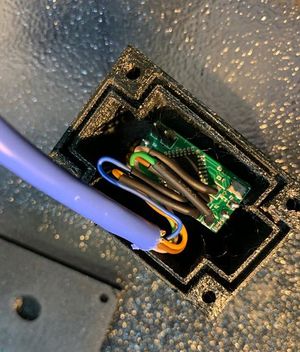
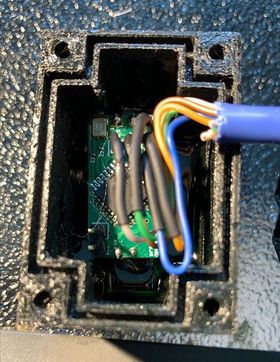
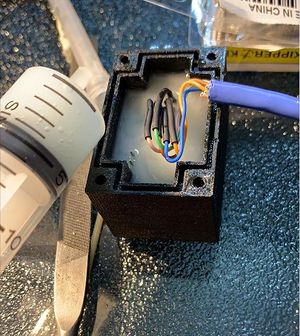
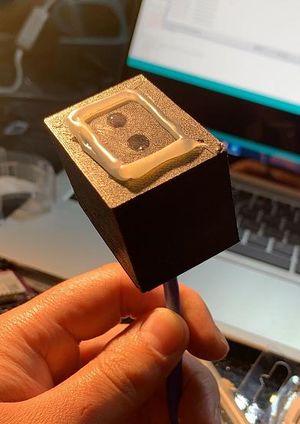
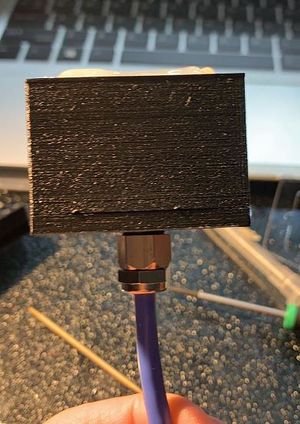

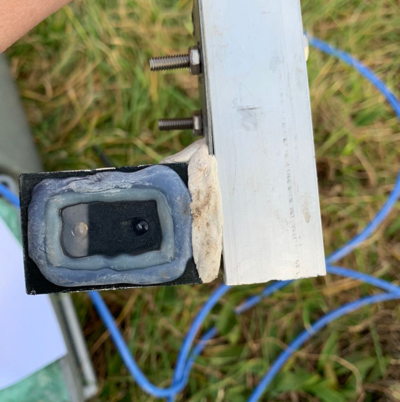
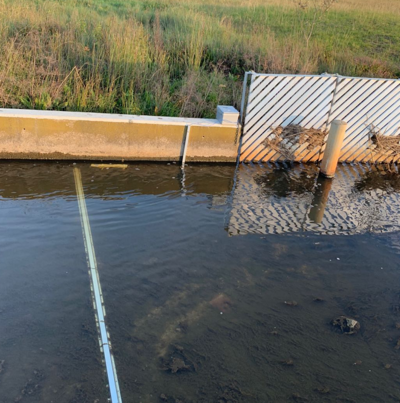
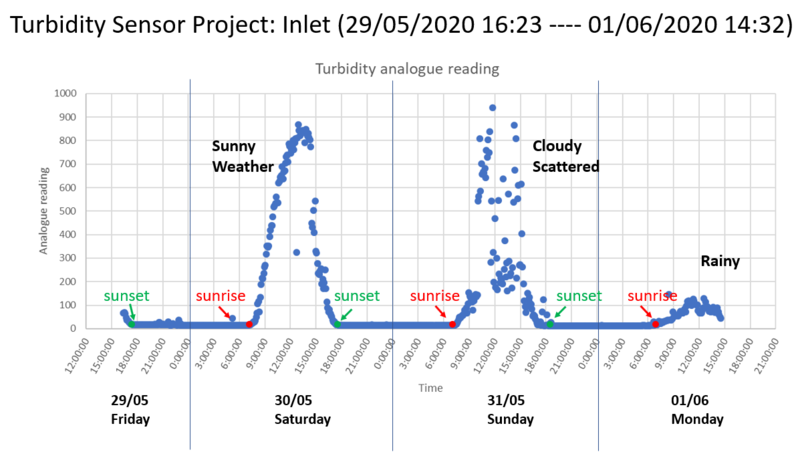
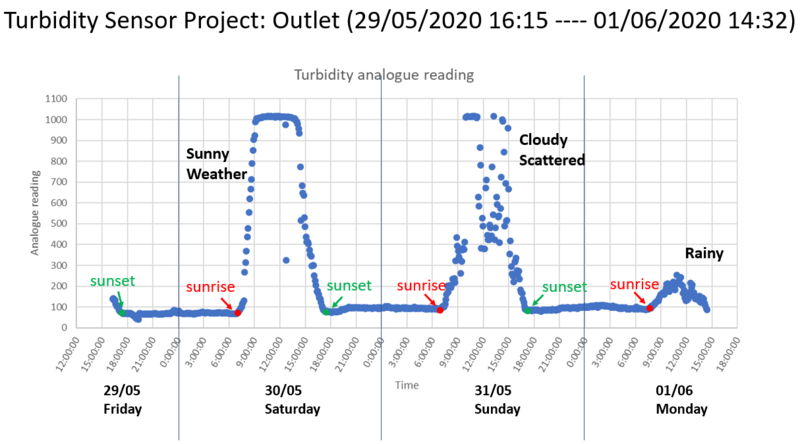
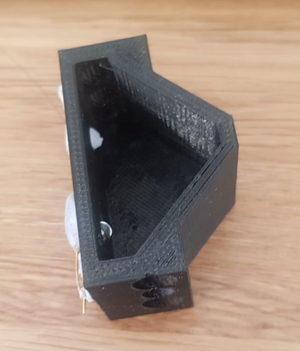
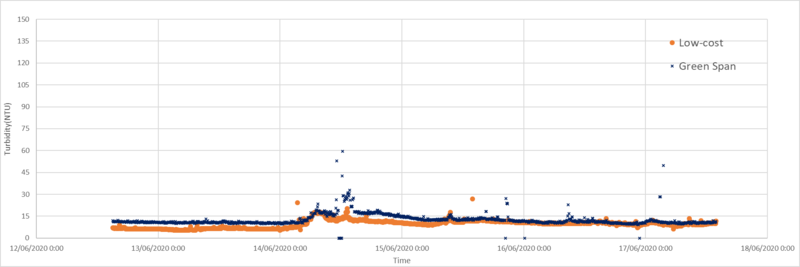
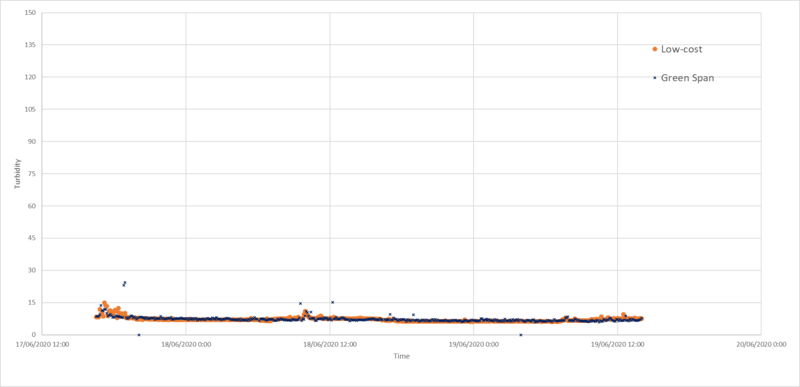
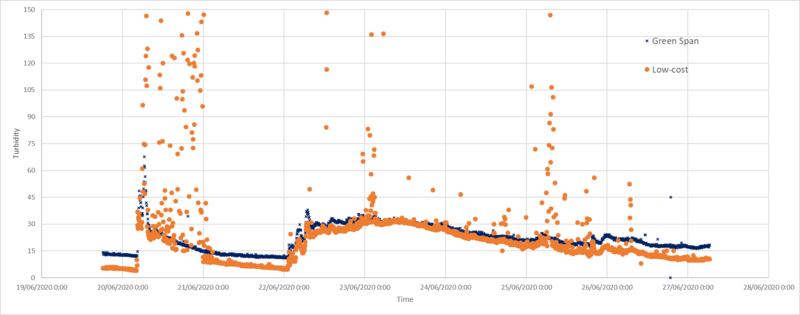
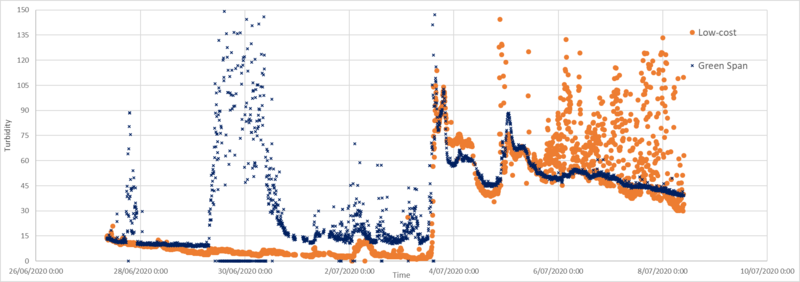
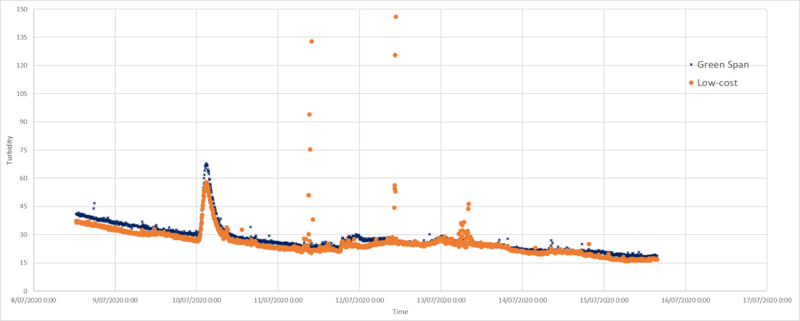
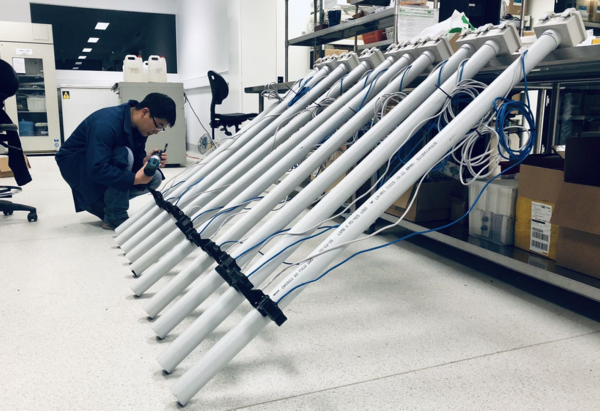
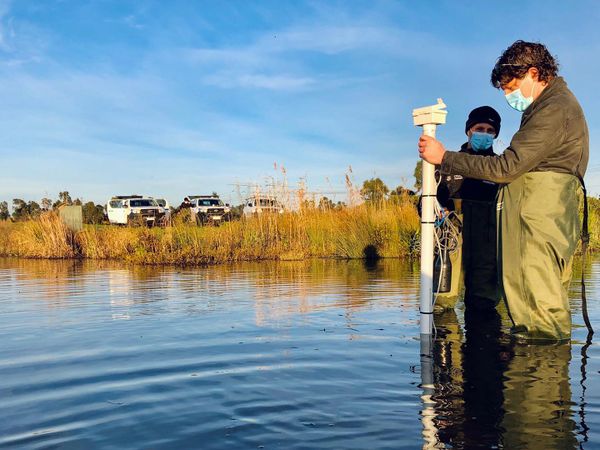
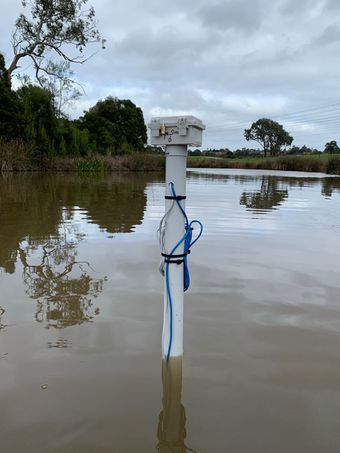
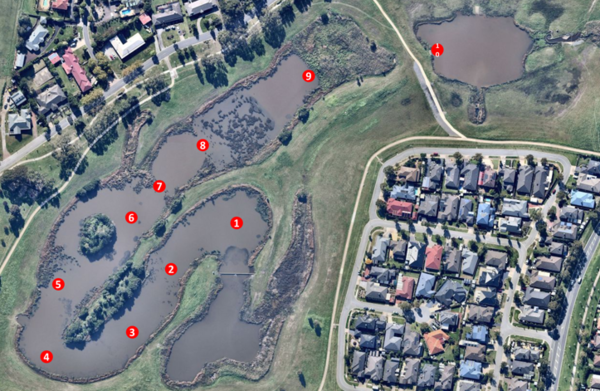
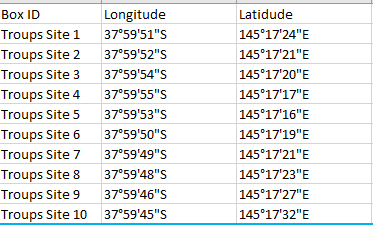



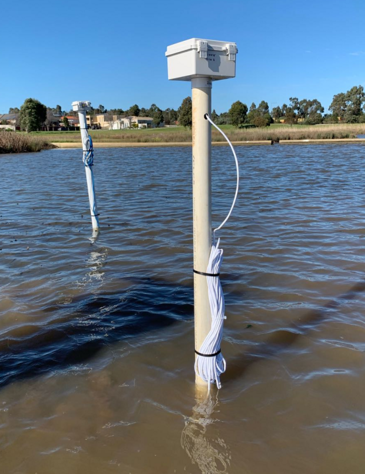
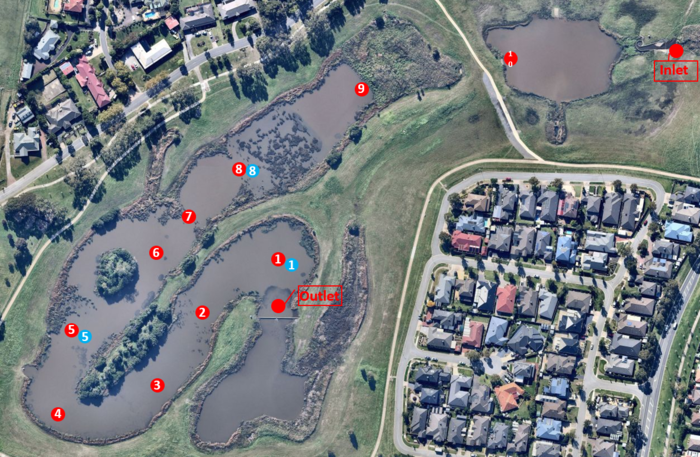


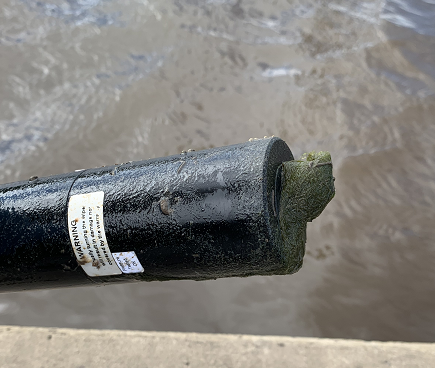


![Plot of the Greenspan sensor results vs Low-cost sensor results at both wetland inlet and outlet, monitoring results [NTU] at inlet (left), monitoring results [NTU] at outlet (right), the orange line show the centre line (y=x), and the blue dash line is the linear trend line for the data series, linear trendline equation and R square are also shown in each diagram](/wiki/images/thumb/a/a0/Statistical_analysis_of_the_comparison_between_the_two_sensor.png/1000px-Statistical_analysis_of_the_comparison_between_the_two_sensor.png)

