Difference between revisions of "Out of Water Turbidity"
| (28 intermediate revisions by the same user not shown) | |||
| Line 1: | Line 1: | ||
| + | == Setup == | ||
| + | For information on how to setup the BoSLcam to work with international carriers, check out the instructions at [[BoSL_Board_nano#LTE_Connection]]. Note that The APN and MCC MNC codes can be changed on the SD card. | ||
| + | |||
== 10 June 2020 == | == 10 June 2020 == | ||
| Line 548: | Line 551: | ||
File:Img64363353.bmp | File:Img64363353.bmp | ||
File:Img643631FF.bmp | File:Img643631FF.bmp | ||
| + | </gallery> | ||
| + | |||
| + | == 21 September 2023 == | ||
| + | |||
| + | I have tried out adding JPEG compression to the images. The results are quite promising. It takes ~6 s for a QVGA image and results in a file and file sizes between 1/2 (quality 3) to 1/5 (quality 2) to 1/30 (quality 1). Overall I'd say that quality 2 offers the best compromise here. | ||
| + | |||
| + | == 9 November 2023 == | ||
| + | |||
| + | I have implemented the JPEG compression into a new firmware: [[File:BoSLcam firmware rev1.1.0.hex.zip]] | ||
| + | This revision adds the new config for selecting JPEG compression. Here is a snippet of the change needed | ||
| + | ... | ||
| + | //image_config_t | ||
| + | uint32_t auto_range_time = 1000 | ||
| + | enum format = 1 //0 BMP, 1 JPG | ||
| + | //ftp_config_t | ||
| + | char* apn = "hologram" | ||
| + | ... | ||
| + | |||
| + | == 16 November 2023 == | ||
| + | |||
| + | The SPI SRAM should be upgraded to have larger capacity. This would mean replacing the 1 Mbit 23LCV1024 with something closer to 8 Mbit, yet still low power. | ||
| + | |||
| + | |||
| + | == 13 February 2024 == | ||
| + | |||
| + | Two BoSLcam with firmware revision v1.2.1 [[File:BoSLcam firmware rev1.2.1.hex.zip]] have been placed in the lab for a long term test. One is set to upload VGA-JPG and the other QVGA-BMP. They have been logging for approximately a week at a 6 minute logging interval without major issue. Today I disconnected the antenna on wdt_qvga in a hope to observe the watchdog timer kicking in and recovery of the BoSLcam, the results of this will be reported in the coming days. For some preliminary results, below are the graphs of the logging gaps and battery voltages against number of logs for both cameras. | ||
| + | |||
| + | <gallery> | ||
| + | File:BoSLcam wdt qvga graph.png | WDT QVGA-BMP | ||
| + | File:BoSLcam dns graph.png | VGA-JPG | ||
| + | </gallery> | ||
| + | |||
| + | Of note is that over the ~1.5k logs only 10 or so were missed and the BoSLcam recovered from each of these. From the gradient of the battery voltage we can find that VGA-JPG image take ~ 0.12 mV/log and QVGA-BMP take ~ 0.07 mV/log (11200 mAh battery). A known issue with this software version is that some lines in the image miss a byte which causes inverted colours. Resolving this issue will need a close look at tightening up the timing of the image readout loop. In total, WDT QVGA-BMP recorded for a total of 7174 images and down to a battery votlage of 3023 mV. | ||
| + | |||
| + | == 16 February 2024 == | ||
| + | |||
| + | Three days later plugging in the antenna on QVGA-BMP, the BoSLcam immediately started logging to FTP again. Based on the uploaded status files (I don't want to remove the SD card yet) the BoSLcam kept taking taking and storing photos to the SD card during the period it was offline, hence the WDT didn't need to kick in. Overall, while this test did not test the WDT, it was still a good demonstration of the reliability of the BoSLcam firmware. | ||
| + | |||
| + | == 19 February 2024 == | ||
| + | |||
| + | Unlike when using QVGA when using VGA, the image quality can sometimes be affected by the focus of the lens. Thankfully the lens focus can be adjusted by rotating the lens. Clockwise screws it in which makes the focus closer and anti-clockwise moves it out which makes the focus further away. Current the best way to check the focus is via trial and error. I have found that about 1/2 to a full turn of the lens is a good initial step to adjust the focus in. Below are two images taken of the same wall where I have adjusted the focus by a about a 1/2 turn. | ||
| + | |||
| + | <gallery> | ||
| + | Boslcam focus near.jpg | far focused BoSLcam | ||
| + | BoSLcam focus far.jpg | near focused BoSLcam | ||
| + | </gallery> | ||
| + | |||
| + | == 20 February 2024 == | ||
| + | |||
| + | Today I will be working on the LED function for the BoSLcam. Some very rough initial visual tests indicate that to produce a well-illuminated spot at 2 m subtending and angle of 20 deg, ~ 100 mA to 200 mA of current need to be passed through the LED. | ||
| + | |||
| + | With regard to driving the circuit, I recommend the below as an effective low-complexity option. One drawback of this design is that the LED current will vary by a factor of ~ 2 between a battery voltage of 4.2 V and 3.5 V. | ||
| + | <gallery> | ||
| + | LED driving circuit.png | LED driving circuit. | ||
| + | </gallery> | ||
| + | |||
| + | Below are images taken with the BoSLcam where the scene has been illuminated with an LED. I have compared three different LEDs: vishay VLHW5100, cree XQAAWT-02-0000-00000B4E3, osram GW CS8PM1.PM-LRLT-XX52-1. I tested the LEDs at two different currents, 30 mA and 90 mA, both of which are above the maximum forward current however, in a finalised design this current can be divided among multiple LEDs. | ||
| + | |||
| + | <gallery> | ||
| + | Cree 30mA.bmp | Cree 30mA | ||
| + | Cree 90mA.bmp | Cree 90mA | ||
| + | Osram 30mA.bmp | Osram 30mA | ||
| + | Osram 90mA.bmp | Osram 90mA | ||
| + | Vishay 30mA.bmp | Vishay 30mA | ||
| + | Vishay 90mA.bmp | Vishay 90mA | ||
| + | </gallery> | ||
| + | |||
| + | Any of the LEDs produce an acceptable image however, I prefer the cree or osram devices as they are SMD and they have a much wider illumination beam which gives them a more uniform image illumination. I think the 30 mA is just a bit too dim and so it will be good to design around a 90 mA current target. | ||
| + | |||
| + | Now it is time to design a PCB for this. | ||
| + | |||
| + | == 18 March 2024 == | ||
| + | |||
| + | A PCB was designed, with three CREE XQAAWT-02-000-00000B4E3 LEDs each with their own 49 Ω ballast resistor. With this design, the LEDs draw between 15 to 30 mA when the battery voltage is between 3.7 and 4.2 V. A DMN2310U N-channel mosfet allows the LEDs to be switched on and off from any of the GPIO on the BoSLcam. | ||
| + | |||
| + | I have also incorporated these components directly onto rev1.2.0 of the BoSLcam. Some care was taken to place the LEDs a few mm away and behind the camera so as to minimise the lens flare. | ||
| + | |||
| + | == 22 April 2024 == | ||
| + | |||
| + | As of firmware revision v1.4.0 the status file format is given as: | ||
| + | DATE-TIME, TIME_SOURCE, CAPTURE_NO, BATTERY_mV, MCCMNC, RSRQ, RSRP | ||
| + | So the log: | ||
| + | 2024/03/22-01:44:27 UTC,NETWORK_TIME,11,4175,310260,13,45 | ||
| + | means: | ||
| + | DATE-TIME: 2024/03/22-01:44:27 UTC | ||
| + | TIME_SOURCE: NETWORK_TIME (time obtained from the network) | ||
| + | CAPTURE_NO: 11 (number of images since last reset) | ||
| + | BATTERY_mV: 4175 (battery voltage (mV)) | ||
| + | MCCMNC: 310260 (the current network operator MCCMNC code) | ||
| + | RSRQ: 13 (reference signal recieved power) | ||
| + | RSRP: 45 (reference signal recieved quality) | ||
| + | |||
| + | == 2 May 2024 == | ||
| + | |||
| + | The BoSLcam rev1.2.0 have arrived. They have been preprogramed with modem firmware v1.3.2 and application firmware v1.4.0, as such they just need a SD card, sim card, and ov7675. No soldering is required anymore! | ||
| + | |||
| + | == 15 May 2024 == | ||
| + | |||
| + | As a further test of the inbuilt LED flash function, a BoSLcam was set up in the den. The picture in the gallery below was taken with the full VGA image resolution and was solely illuminated by the builtin LED flash. The wall was 2 m at its closest point to the camera and 3 m at its furthest. A comparison image is also provided with the LEDs turned off. It is fairly clear that the LEDs improve the ability of the BoSLcam to take images without an ambient light source. It seems that during this test the BoSLcam died of low-signal strength, however it was able to recover a day later via the WDT. A good test of the feature! | ||
| + | |||
| + | <gallery> | ||
| + | Inbuilt-den-image.jpg | Image taken with the BoSLcam rev1.2.0 using only the builtin led flash for illumination. | ||
| + | Inbuilt-den-off-image.jpg | Comparison image taken with the LEDs turned off. | ||
</gallery> | </gallery> | ||
Latest revision as of 01:28, 20 May 2024
Contents
- 1 Setup
- 2 10 June 2020
- 3 13 June 2020
- 4 14 July 2020
- 5 20 July 2020
- 6 21 June 2020
- 7 22 June 2020
- 8 24 June 2020
- 9 19 November 2021
- 10 14 January 2022
- 11 20 April 2022
- 12 27th April 2022
- 13 22nd June 2022
- 14 23rd June 2022
- 15 30th June 2022
- 16 1st July 2022
- 17 4th July 2022
- 18 21st July 2022
- 19 25th July 2022
- 20 2nd August 2022
- 21 13th September 2022
- 22 14th September 2022
- 23 15th September 2022
- 24 3rd October 2022
- 25 10th October 2022
- 26 22nd November 2022
- 27 24th November 2022
- 28 29th November 2022
- 29 2nd December 2022
- 30 5th December 2022
- 31 6th December 2022
- 32 7th December 2022
- 33 8th December 2022
- 34 15th December 2022
- 35 16th December 2022
- 36 19th December 2022
- 37 21st December 2022
- 38 11th February 2023
- 39 14th February 2023
- 40 20th February 2023
- 41 23rd February 2023
- 42 6th April 2023
- 43 12th April 2023
- 44 21 September 2023
- 45 9 November 2023
- 46 16 November 2023
- 47 13 February 2024
- 48 16 February 2024
- 49 19 February 2024
- 50 20 February 2024
- 51 18 March 2024
- 52 22 April 2024
- 53 2 May 2024
- 54 15 May 2024
Setup
For information on how to setup the BoSLcam to work with international carriers, check out the instructions at BoSL_Board_nano#LTE_Connection. Note that The APN and MCC MNC codes can be changed on the SD card.
10 June 2020
In addition to turbidity it would be interesting to test if velocity could be measured using the sensor by tracking the motion of objects on the surface of the water.
The first step is to investigate if the idea is viable. To do this it would be good to gather raw data on what a camera would see when in a drain. From this we will be able to see how turbidity levels affect the image and determine ways to determine to extract the turbidity component using the small processing ability of the ATmega328p or a similar micro-controller.
The ArduCam module was tested as it is likely to form the backbone of the out of water turbidity sensor. Its standard library was downloaded and it was wired to an Arduino Uno on 5V. This worked well, and photos were able to be taken. Next the power supply was changed to 3.3 V. This also worked well and the camera appeared to still be working normally.
When it was attempted to be connected to a BoSL board. It raised the error of not being able to detect the camera. Currently the 8MHz speed of the ATmega on the BoSL board is the suspect. Plugging in the I2C lines of the device in addition to the SPI lines allow the camera to work somewhat on the BoSL board. The connection is unreliable though, and photos will commonly not transmit. It seems that this issue is mostly due to bad quality wires used in the connection. Holding them down while trying to take a photo mostly solves the issue. The baud rate of the serial port was also decreased to 115200.
13 June 2020
Instead of a BoSL board, initially a Arduino MKR zero will be used to connect to the Arduino CAM in the drain. This is because it has an integrated SD card for storing photos, additional processing power, and is much smaller and compact. It also has an RTC which can be used to set the time of the photos.
It was found that the Ardu CAM code compiled on the MKR zero with no adjustments needed. The camera performance was about the same as on the 3V3 BoSL board: some photos were corrupted however it is thought that this is more to do with the cabling than the powering of the device off 3V3 volts itself.
14 July 2020
The SPI clock speed was adjusted on the Arduino MKR zero to get maximum reliability from the ArduCam, it was found that a clock speed of 1MHz provided the optimal stability.
When logging to SD card the ArduCAM is much more reliable. However an issue is had with the auto exposure system. Taking one frame at a time solved this issue.
The power consumption of the Arduino MKR Zero wsa measured, it was found that the operation used 150 mA, of which the SD card took about 30 mA. Putting the ArduCAM module into low power mode reduced the current consumption by 70 mA.
The SAMD21 also has low power modes. It was difficult to be able to get these to work, and issues were had with activating the serial port after sleep.
The native usb serial port is not able to easily be reactivated once the MCU goes into low power mode. An alternative is to use the Serial1 port. This requires an external USB-ttl converter however the USB is only needed for development so it is a viable work around.
In full sleep mode the whole setup uses 62mA, 57 mA of which are drawn by the camera module. This is when its in its lowest sleep state. A transistor may be needed to switch on an off the module to achieve suitability low power consumption.
20 July 2020
In order to reduce current to acceptable levels during sleep, it was experimented if it was possible turning off the supply voltage to the device. Two BC557 PNP transistors were used in parallel to control the VCC to the arduCAM. This did have the effect of reducing the voltage of the VCC pin to aobut 2.9 volts when on, however this didn't seem to affect the performance of the camera, which still worked well. What was found to be an issue was that the camera did not want to re-initiate once the VCC was powered again.
The above issue was fixed by reinitialize the camera from the library every time it was powered on. In sleep mode the whole setup now uses 5mA. Not completely ideal however significantly better than before.
Work was also done to get the image output in BMP, this was less trivial than assumed, the current version is limited to QVGA in BMP mode. Additionally, the BMP files are quite large 150 kB and so take some time (about 2 seconds) to transfer to the SD card and store. It is potentially possible to throw away pixels and decrease the resolution of the image to make this process faster.
It was found how to set the white balance of the camera. By default this is set to auto on the ArduCam however I have now set it in the script to the predetermined 'Sunny' setting. This should ensure more consistency in the colors recorded by the sensor, critical if we wish to use this to determine turbidity.
21 June 2020
Code was written to upload the time photos were taken on the ArduCam to the cloud. The idea is that the ArduCam could be installed with a turbidity sensor. Comparing the turbidity measurements to the photos should allow us to see if there is a good method of determining turbidity from the image taken.
Above is a basic schematic diagram of the setup. The arduino MKR zero and the arducam will be located in the drain and connected via a cat 5 cable to the bosl on the surface.
22 June 2020
A case was printed for the ArduCam. Since in the prototype version the arducam is connected via jumper leads the case needs to be large to accommodate the run of these cables.
The case turned out a bit large, and it was found that a smaller one would still have room to fit all the components. This will be designed now.
24 June 2020
A new box was printed to better accommodate the size of the ArduCam and Arduino. They fit quite well. A lid is still to be printed.
Issues were had with the wire used to connect to the BoSL. The ArduCam requires about 100 mA. It was found that the CAT5 cable had a resistance of 4 Ω over 10 meters. This meant that significant voltage drop occured over the length of the cable causing power instability issues. A fix was found by powering the device with VBAT instead of 3V3 and adding a 100 μF capacitor between the voltage rails on the sensor side. It is noted that this will have implications for longer cables when used on the BoSL Bus notably maximum current draws particularly on longer cables.
With the lid attache the final enclosure looks like this: Note it is not waterproof and should be kept dry.
To wire up the sensor the following connections are to be made to a BoSL board.
| Sensor | BoSL |
|---|---|
| GREEN | VBAT |
| HALF GREEN | GND |
| BROWN | D9 |
| BLUE | D8 |
| HALF ORANGE | D7 |
The BoSL code is: File:BoSL Host out of water turbidity.ino
And Arduino MKR zero code: File:Turbidity out of water.ino
The function of the logging setup is to take 5 pictures spaced 2 seconds every 2 minutes. These are saved to the onboard SD card along with the a timestamp. The timestamps are also then uploaded to the BoSL testing site (http://www.bosl.com.au/IoT/testing/a.php) under site name: TURBID_TEST
19 November 2021
In the year and a bit since the last work on this project was done, new sensor technologies may have come out. Therefore, we will investigated if there now exist any better implementations for an low power/cost camera system.
The current solution of using the Arduino Cam is unideal for a few reasons. The first being that module was not designed for ultra low power operations, hence the changes and usage needed to add low power features cause the system to be buggy, additionally the sensor has a very high resolution of sever megapixels. This is more data than we need to detect the tubudity of the water and more data than is reasonably processable on a microcontroller.
Some new solutions include:
https://www.digikey.com.au/en/products/detail/sparkfun-electronics/SEN-15570/10819696
This is small self contained imaging module which has a sensor resolution of 320 by 320. It is addressable by I2C, operates off 3.3V and requires on the order of milliamps of current in operation. Many other similar devices appear to be available at: https://www.uctronics.com/1/9-ov7675-standalone-vga-coms-camera-module.html and here https://www.arducam.com/compact-camera-module-oem-odm/
The ideal set of qualities we are looking for in the image sensor module is:
- Low Cost
- Low Power (mA) on 3.3V supply
- ~QVGA resolution and RGB colour
- easy to interface (I2C, SPI preferable)
- infinity focus
- small (TBD)
- suitable physical connection interface (TBD)
Following investigating the different products available, the arducam OV7670 (https://www.uctronics.com/arducam-ov7670-camera-module-vga-mini-ccm-compact-camera-modules-compatible.html) looks to be the best suited camera for our application. It fits the cost requirement at $4, the current requirement, VGA, it operates through the SCCB bus, which I haven't had as much experience in, but looks reasonable. However the field of view of the camera is a bit small at 45 degrees.
14 January 2022
Performing some further research it seems that the OV7670 is deprecated, it might therefore be worthwhile to use the OV7675, which is the updated version of the OV7670. Specifically the differences are that the newer sensor uses a slightly smaller sensor, has greater standby current. (60 μΑ vs 20 μA), and has a greater sensitivity to light. Both seem to be support by this arduino library https://github.com/arduino-libraries/Arduino_OV767X, so switching between the two later if needed should not require substantial reworking of the design.
20 April 2022
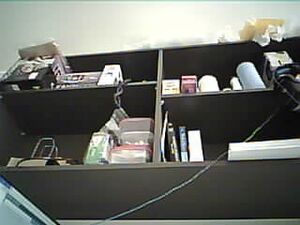
To experiment with these different camera modules and gain an understanding of how they operate, first we will test the camera modules with the Arducam ESP32S UNO PSRAM development board. This board is an arduino which has the OV2640 camera connected onto it. Arducam provides starter scripts to begin working with the camera. Following their guide photographs were able to be captured and stored on the SD card. A typical image from the camera is shown below.
It was found that changing the resolution of the image did not affect the field of view of the image. This allows us greater freedom in choosing a camera with a higher resolution than needed as if downsampling of the image is needed for memory of processing constraints this will not need to crop the image. A quick measurement confirms that this field of view is about 60 degrees.
The example script gives the needed functions to adjust all the key camera parameters (white balance, exposure, contrast, gamma, etc) these will likely need to be set manually for the out of water turbidity sensor as we want a consistent conditions to match images to colours of turbidity. Looking at the code it seems that the setting of these values occurs through setting corresponding bits in the registers mentioned in the datasheet. The manual white balance was a bit difficult the script gave only 4 presets none of which worked very well in the indoor lighting conditions.
27th April 2022
In addition to choosing the correct camera, a lighting system will also be needed for when there is no light in the water system. Using a camera flash is one option, however this will likely need to be a pre-built flash module due to the high voltages involved. An alternate option is using LEDs with a longer exposure time. To see if this is viable we note that the sensitivity of the camera is 1.8 V/(Lux s) and the dark current is 10 mV / s.
Assuming that the led light is co-located with the the camera, then once can calculate that the needed exposure time to get a 50% grey is:
Where Texp is the needed exposure time, Vexp is the 50% grey voltage (~1 volt for our use cases), η is the reflectivity of the water surface, σ is the sensitivity of the camera (~1.8 V/(lux s) for the types of cameras we are using), Icd is the luminous intensity the leds used, θv the half the field of view of the camera, and H the height of the camera and led above the water. For a higher power white led with luminous intensity of about 33 candela and a distance to the water surface of 3 m this gives, a 20% reflection of the water surface and the OV7675 camera module this gives an exposure time of about 7 seconds. This is probably just on the edge of a feasible exposure time, so with higher power or multiple LEDs, using LEDs to illuminate the water subject should be feasible.
Ideally we would want the colour temperature of the LEDs to match that of the sun so that the difference in the illumination conditions can be minimised. Additionally a narrow angle LED would be preferred so the light isn't wasted outside the field of view of the camera something like (https://cree-led.com/media/documents/C503C-WAS-WAN-1098.pdf) would be ideal. Such LEDs tend to find application in road signs or torches when illumination at a long distance is needed.
22nd June 2022
The OV7675 was now used with the Arducam Shield V2, images were captured in QVGA resolution in an RGB565 format into a bitmap. The last row did not have usable data so the resolution ended up being 320 by 239. A sample image of a test chart is shown: Using the arducam library function wrSensorReg8_8, various sensor registers could be controlled such as test patterns and auto-exposure.
A very long exposure could be achieved by turning off auto exposure and then adjusting the clock divider in the CLKRC register. Doing this it seem that an exposure of at least a half a second was able to be achieved.
23rd June 2022
The gain and white balance were also able to be controlled manually using appropriate registers. By setting all three to manual mode a consistent image could be taken regardless of the external lighting conditions. This will ensure repeatability when performing turbidity tests. A mounting is being design to attach the arducam shield to the edge of a tank for testing.
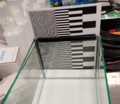
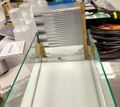
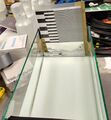
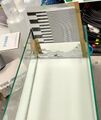
One idea to solve this was to place the paper in a plastic pocket inside the water. This somewhat worked, from some angles the gradations were visible while from others it was not. Below are images of the tank from the different angles.
30th June 2022
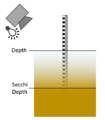
One measurement principle to test is the one described below:
Here a graduated paper is placed into the water, for a given turbidity the camera will only be able to distinguish the gradations to a certain depth before the solution becomes opaque, measuring this depth will give an indication of the turbidity. This depth should roughly be equivalent to the Secchi depth with the obvious difference that the viewing angle will not be directly vertical.
As a first test of this a page was printed with different gradation sizes, this was to be placed on the outside of a glass tank which a camera could image through. This does not work however because from the viewing angles of the camera the glass tank becomes reflective and anything behind it cannot be seen.
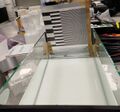
Based on these images, mounting the camera relatively high will enable clear view the gradation. This is ideal, as presumable this is how the sensor will be mounted once installed, at the top of the pipe.
Next are images of the tank from the camera at both no turbidity and after some soil has been mixed into the water creating a turbidity of 55 NTU.
It is noted that the frequency of the gradations increases underwater, this is due to the light's refraction. This might be very useful as it provides a way to distinguish where the water surface begins. It is also realised that only a small vertical slice of the image is needed. If so we can discard most of the vertical resolution in the image, this would allow us to have a higher horizontal resolution at the same processing cost. The simplest method of analysis is to plot a vertical section of the image. Or more precisely plot the horizontal integration of a small slice. This is done for the two sample images above.
From these histograms it is clearly seen where the water surface begins as the frequency of the oscillations increases and where the effect that the turbidity has on attenuating the oscillations. These should be fairly easy to measure with an MCU.
Some issues which will need to be through through
- This water is very still, flowing water will not have an optically transparent surface.
- It seems that low turbidities have a low visibility distance. This visibility distance will be constant regardless of the scale of the system. That is when this test is scaled up, the visibility will still be the same. This may require a very fine gradation.
1st July 2022
If the surface of the water is disturbed with ripples then this method has issues. As shown in the gallery below, once the surface is disturbed it is very difficult to view the gradations below the surface. The gradual attenuation of the gradations as seen for the still water are no longer present and now a sharp discontinuity occurs and the gradation oscillations suddenly disappear.
Given that most of the of the sites where the sensor will be installed will likely not have a unperturbed water surface most or all of the time. Using the visibility of the gradations under the surface is not going to be a very robust methodology for measuring turbidity. Perhaps however by placing this measurement system inside a rectangular tube or PCV pipe, the water surface will be able to be protected enough that the gradations will always be able to be seen.
4th July 2022
A test of the turbidity measurement system with more turbidity stops is going to be tested. The glass tank was first filled with 12 L of water. A small amount of sediment was added and then the turbidity was measured with a Thermo scientific Orion AQ4500 turbidity meter. Images were captured with the the camera and the process was repeated. The following turbidity values were found:
| Sediment (g) | Turbidity (NTU) |
|---|---|
| 0 | 1 |
| 2 | 9 |
| 3 | 17 |
| 4 | 21 |
| 5 | 28 |
| 6 | 34 |
| 7 | 32 |
| 8 | 38 |
| 9 | 45 |
| 10 | 52 |
| 12 | 60 |
| 14 | 70 |
| 16 | 86 |
| 18 | 105 |
| 20 | 111 |
The gallery below show the level cross sections of the the images taken. It is seen that until about 30 NTU there is quite a nice relationship between the turbidity and the attenuation of the gradation oscillations. It is seen that the white level of the oscillations tends to remain stable while the black level of the oscillation is what increases with depth as the turbidity increases. Beyond about 30 NTU issues with visibility depth being very small and the water reflection overpowering transmission through the water become dominant. The red box in the images show where the level cross sections were taken over.
The first idea was to fit a decaying sinusoid to the data and extract the decay rate as the measure of the turbidity. This did not work as planned due to the perspective of the camera giving making the gradation period not constant. The second idea was to take the absolute value of the data about the oscillation and fit an exponential to this. This worked better and a graph below shows a fairly linear relationship between the fit constant and the turbidity at low NTU.
Based on the issues had with the gradation, I will a new target sheet which is just a solid colour. I think this may be easier to process with decay fitting.
21st July 2022
A new gradation was tested. Images are provided below for both when the water is standing, and when there is strong turbulence. As per the images, in still water all three lines, the black, which and alternating can be distinguished. Once the water becomes turbulent, the alternating gradation becomes a uniform grey, and the graduations cannot be distinguished. The black and white lines however, while they do become harder to see, a vertical line of either black and white can still be resolved. Hopefully this should enable some comparison between the the intensities of the black and white levels to determine the turbidity. A more detailed test of this will now be conducted.
When the intensities of the vertical strip in the turbulent water are plot, the follows graphs are obtained. Some points of interest are that the black level stays relatively fixed. The difference between the black level and the white level may give a reasonable estimation of the turbidity.
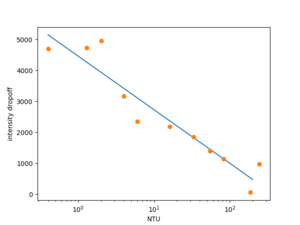
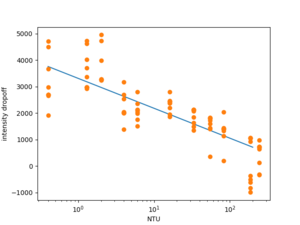
To produce a reading out of the images, the intensity difference between the top of the water and the bottom of the water was taken. For this test this was chosen manually for each image. The results are provided in the graph below with a fit line for the linear region.
It is seen that between about 8 and 80 NTU, the relationship between the intensity drop-off and the turbidity is very linear (R^2: 0.994). At turbidities less than 6 NTU the intensity drop-off falls very quickly, above 80 NTU, this metric appears to saturate and lower intensities are recorded. It should be cautioned that only 5 data points are used in the fit, which is relatively few. This demonstrates that this using the intensity drop-off in turbid water may be feasible even when the water is highly turbulent.
25th July 2022
Another measurement method is to consider the integral of the intensity difference between the black and white strips as a function of the water depth.
A folder of graphs of this method applied to the disturbed water images is available here: File:Turbidity integral graphs.zip. The values seem to follow a logarithmic distribution when plot against turbidity (see below)
The fit has an R^2 value of 0.88 and seems to mostly be monotonic in turbidity. For this analysis the integral was evaluated up to the 125th pixle, just below the water level.
Some benefits of this analysis method include:
- The use of integration averages the noise from a number of individual pixels, this should contribute to a noise reduction in the method.
- This idea is somewhat physically based. One would expect that the greater the scattering the more quickly the gradations become invisible.
Some challenges include:
- Minimising the effect of reflections on the water surface
- Measurement of the water level for the bound of integration
- How the changing water level will affect this turbidity integral
2nd August 2022
As multiple images were taken for each turbidity during the test, we can add more of these images to the analysis to see the image to image variance in the measured turbidity. This is done in the plot below:
It is seen that there is quite a lot of spread in the turbidity measurements of a single image. One major factor to the variance may be that when the water surface is turbulent its high may change by a few mm. As we are integrating to a fixed point on the image, this may change the results.
13th September 2022
A few other methods of determining the turbidity based on the image colours were explored. These were very simple algorithms mostly focused on the average colour of a certain region. The following algorithms all used the greyscale images, and the turbidity images with the agitated water surface. Greyscale was used as other image channels were trailed, however they only showed marginal differences from using the greyscale and most of the differences were negative. It is possible that some more complex combination of the image channels may provide an advantage.
Below are three such different methods with linear regression. The exact coefficients of the regression do not matter too much, as they are dependant on the type of value being measured by the method. The R^2 value and the overall variability are however the more important metrics.
The average value method takes the average pixel value in a section of the image. The sections is chosen such that it when the water it clear the white paper can be seen behind the section. The value difference method takes the average pixel value in the method above and subtracts it from the average value a section of out of water white paper. The value ratio method is similar however it takes the ratio of these sections.
The idea behind the value difference and value ratio methods is to compensate for any differences in lighting and image capture with the reference white section.
The three methods all provide good linear correlations with the turbidity. The average value method is not preferred as it is the least monotonic, that is that multiple different turbidities have similar outputs from the method. Value difference and value ration are better at this and the data does not currently support the use of one over the other. This indicates that the use of the white section to compensate for differences is a good help.
Averaging over a large section seems to also be a good way to avoid the impact of the various reflections in the water surface. These methods still need a good way of determining the water level, so that the right sections can be averaged.
14th September 2022
The above three algorithms were rerun with 5 disturbed water surfaces and 5 still water surfaces, to get a better understanding of how the method extends to larger datasets. The graphs are provided below:
All three algorithms perform better than the previous integral method. It is noted that the average value method performed on par with the ratio method when compared by r^2 fit. The value difference method this time seem to have the greatest spread of readings for the same turbidity.
15th September 2022
A simple algorithm for detecting the water level has been tested. First the average intensity of a vertical column with a white paper backing is plot. Above the water the intensity of the white paper remains fairly constant, however, even at no turbidity, once below the water a sharp decrease in intensity occurs. Therefore, a gaussian filter of a few pixels standard deviation and order 1 is applied to the intensity, this had the effect of a smoothened derivative filter. From here the first peak in the derivative starting from the top of the image above a given threshold (here it is 2 counts/pixel) is determined as the water level.
Applying this algorithm to all the turbidity sample images, the water level can be reliably detected. This works both in the still and rough water surface case. A few sample images are shown below, as well as all the images in the a zip archive.
Challenges to generalising this algorithm to the field include;
- The intensity gradient threshold may be needed to be larger or smaller in different installations.
- bio-film will build up on any white surface, and will lower the reflected intensity measured by the camera (perhaps in a non-uniform way)
3rd October 2022
A bit of work on the prototype hardware was completed today. A guide was found on how to connect the OV7675 directly to an Arduino Uno (https://circuitdigest.com/microcontroller-projects/how-to-use-ov7670-camera-module-with-arduino) this was followed and I was able to stream the picture data over serial to the computer. Others have had success with connecting these embedded cameras directly to an RP2040 MCU (https://www.uctronics.com/arducam-pico4ml-tinyml-dev-kit-rp2040-board-w-qvga-camera-bluetooth-module-lcd-screen-onboard-audio-more.html). The RP2040 is low cost but capable MCU (and in stock), the one disadvantage which it has is that is that its lowest power state consumes current in the milliamperes. Its SRAM is large enough to store a single complete QVGA frame from the OV7675. To trial this MCU system, the reference design the the RP2040 was extended to include a connector for the OV7675 breakout board and the camera module itself. Various jumpers have been included to aid in debugging to the board.
10th October 2022
An idea was also had to use an nRF9160 as the MCU for the camera board. This would have the following consequences for the design:
- Higher cost ($30 vs $3)
- Faster uploading
- Lower power usage
- No need to external bosl logger
- familiarity with programming the nRF9160
- no examples for camera modules with the nRF9160
For certain applications given that no BoSL would be needed, the total application cost would come out to be less. I would also suspect the uploading would be more reliable with the integrated nRF9160, as the data from camera would not need to be relayed through the MCU, BoSL MCU, and then finally to the SIM module.
22nd November 2022
The prototype development board which connects the nRF9160 to the OV7675 camera was soldered today. So far I have been unable to connect the onboard nRF9160 to the SEGGER J-link to program and work with the device. Perhaps this is a soldering issue. After a few trials this issue was determined to be a soldering issue which was solved. The solution involved using low temperature solder paste, elevating the board so that the heat was not drawn out by the desk surface, and removing the nozzle on the hot air gun so that the heat was distributed more evenly. Also using a high-ish temperature ~420 C and low airspeed seemed to work better. Once this was done the nRF9160 could be programmed by the J-link. Some improvements related to simplifying the PCB schematic were also noted, and these were implemented for the next revision of the PCB.
24th November 2022
The first step to controlling the OV7675 is to get the I2C component of the SCCB bus working. It was found that in order to get responses from the OV7675 I2C a minimum of the power, ground, scl and sda (with pullups), XCKL (with clock signal), PND to gnd, and PEN to VCC are needed.
29th November 2022
I2C responses were able to be achieved on the dev board. This was achieved using the pin activations described previously. The XCLK clock was made to be an 8MHz square wave. This is somewhat difficult to achieve on the nRF9160 but once set up works reliably. Specifically, you need to use the DPPI system, which is able to connect the timer peripheral to the gpio (gpiote) through a system which uses tasks and events. Events are published to the DPPI when something happens on a peripheral, this causes all subscribed tasks on the channel to be initiated. Here the event is the timer compare register matching and the event is a toggle of the GPIO pin. The trickyness in this was ensuring that the peripherals were connected to the DPPI bus correctly via the nrfx hal code. From here the ov7075 code could be ported from the ATmega to the nRF9160, the next steps are to read in the GPIO image data. The pixel clock can be chosen to be relatively slow ~ 70 kHz. As the nRF9160 has enough memory to store image data, we can read it directly into memory. Doing this an image could be read out from the camera. There is still some work to determine the exact pixel formats, and register settings for perfect image quality, but in the mean time here is a sample image:
2nd December 2022
The camera was attempted to be connected directly to the PCB using the flat flex cable connector. This did not work however as it was found that the pinout was wrong. It was also found that for the breakout board connector pins D0 and D1 were swapped around, this may be something to note when attempting to correct the image data issues.
5th December 2022
After some tweaking of registry values and the code used to read the data from the camera, a working qvga image was able to be extracted the OV7675 onto the nRF9160. An example is given here.
The one issue with this current setup is that the image is stretched vertically in a 2:1 ratio.
6th December 2022
The SD card was able to be made to talk to the nRF9160. The configuration was quite picky with which options needed to be set in order for the communication to work. As such I am uploading a zip of the project which can be build with nRF SDK v1.9.1 here for reference and backup purposes. File:Camera native-sd.zip
One important note is that the nRF9160 supports only 4 serial devices which can be either configured to be SPI,I2C, or UART. Currently we have used SPI3 for the SD card and I2C2 for the camera. UART0 is used for logging/debugging. This leaves device 1 which we will either use for another SPI device like flash memory, or another UART so the board is able to talk to other boards.
The sd can be accessed via a unix like file system. The root of the SD card is at /SD:/. From here it was simple enough to write the image buffer data to file on the SD card and view this on a computer.
7th December 2022
After some more twiddling with the settings, configurations, and libraries the LTE modem was able to be activated and register to the network. Internally it seems that the modem talks to the application through the same AT commands that are used in the serial LTE modem. Most of the common AT+ commands are there however some of the more exotic AT# or AT% commands are not. It seems these ones are related to external libraries which have their own functions to operate. FTP is one of these libraries, however all the ftp functions can be accessed through the ftp_client.h library. From here I was able to connect to the FTP server and easily put a file. Now comes the integration of all three firmware functions.
8th December 2022
An issue was identified with the FTP uploading. Images uploaded via ftp from the nrf9160 would have all bytes of 0x0d (\r) removed from the file. This is because the default mode is to send the file in FTP text mode, where as for image data FTP binary mode is needed. I am looking into how to entre ftp binary mode now. A typical FTP image is shown here. The upload link speed is about 8 kB/s, hence uploading once QVGA RBG565 photo takes about 20 seconds. Now the task is to develop a program capable of reading a config file off the SD card and begin to log images according to this config.
15th December 2022
A basic program for uploading and storing the arducam images has been completed. It is now time to focus on measuring and optimising power consumption to ensure that the device is able to have a strong battery life. The first step with this was to power the board with an inline shunt resistor. The voltage drop across this resistor can be measured with an oscilloscope to measure the current via Ohm's law. In the current code state, plugging the board in it draws about 40 mA of current, which is quite high. After the sd card has been mounted sdhc_mount(), the current drops by 15.6 mA. With no SD card inserted the idle current draw is 17 mA.
With the SD card, the sim, and the OV7675 module removed, the current draw falls to 1.36 mA under a k_msleep() loop. Now with the SRAM IC (23LCV1024) CS pin pulled high, the idle current is 800 µA. This is an improvement but is still in the 100s of µA range.
16th December 2022
With all peripherals disabled the idle current consumption of 37 µA could be achieved. It was also found that the pullup resistor on the nRESET pin was not needed as it was internally pulled up to 2V2. The target idle current is about 4 µA. A 100 kΩ pull up resistor on the SD CS line may be to blame, so it was removed. This however did not have a significant impact on the sleep current. After a fair bit of troubleshooting no further improvements to the current consumption could be found. Now we need to work on how to fall and wake from sleep. In particular how to configure all the peripherals such that they are able to effectively resume from sleep. For the SD card, and SPI the build flag CONFIG_PM=y does a good job of this. However it should be noted that some SD cards have a much higher idle sleep current the san disk which I have been testing with goes up to 400 µA!. For this reason we should probably add a MOSFET to control the SD card power. For the SRAM, only the CS pin needs to be pulled high. For the LTE modem, it seems that enabling PSM will reduce the power of the modem to a few µA. The advantage of PSM is that it seems like it goes not need to reregister to the network when it wakes up from sleep.
19th December 2022
After some further investigation is is determined that the power switch on the OV7675 is not necessary as pulling the PDN pin high cuts the current to single µA. This concludes the power testing of the out of water turbidity sensor. It is estimated that the final idle sleep current will at worst 70 µA. It is now time to design the final compact PCB.
21st December 2022
The initial release of the BoSLcam/out of water turbidity probe was made. This is a miniaturised version of the dev board, in the same form factor as the BoSLnano. As always, it can be found in the design library Design_Library#BoSLcam 1.0.0. Some pictures of the front and back of the PCB ware provided.
11th February 2023
To use the BoSLcam with the supplied firmware the following config file needs to be placed in the root directory of the SD card. It contains all the configurable options for how the camera will take photos and upload them to the FTP server. File:Bosl cam configuration .txt A handy note is that to upload a file via FTP takes on the order of 1 minute
14th February 2023
The BoSLcam have arrived for tested. After powering the device and connecting the debugger probe the SWD debugger could connect to the nRF9160 MCU. The next step was to close the SD card power jumper to 3V3. It was found that the modem firmware needed to be flashed. This could be done by following the instructions at https://devzone.nordicsemi.com/f/nordic-q-a/52018/programming-nrf9160-modem-firmware-with-a-stand-alone-segger-j-link and flashing modem firmware version 1.3.2 available here https://www.nordicsemi.com/Products/nRF9160/Download#infotabs. This needs to be done with the segger probe.
It also appears that the test firmware supplied to the assembly house does does not allow for normal operation such as taking pictures. To do this a new firmware need to be uploaded. Specifically this one File:BoSLcam firmware.zip. Which can be uploaded with Segger J-flash or J-flash light
Here is an example image which comes out of the camera
20th February 2023
The aspect ratio issue of previously seen in the camera has now been corrected. This was done by switching to the https://github.com/arduino-libraries/Arduino_OV767X library to set the OV7675 registers. We also switched to the CIF image size (352 * 240). The last issue now seen is that the edges of the image data seem to be gibberish though this may be fixed by further adjusting the frame size registers. Proof of the correct aspect ratio is now seen in the below image which shows the back of a circular pen as a circle rather than an oval. From this experimenting it seems that adding a break point between initialising the camera and setting the hstart and hstop values will cause the stretching issue. odd.
23rd February 2023
An interesting note is that the length of the pixel clock changes with the resolution mode chosen with QVGA and CIF having half the pixel clock compared with VGA. Horizontal line scan time does not change, nor does the time between VSYNC pulse. This implies that the number of lines are the same between all the video formats. In part, this explains why we were having issues with the stretching on the QVGA video settings, we were reading every line out of the camera assuming that there were only 240 of them, whereas there were actually 480 of them so we were only getting the first half of the frame. In short, while changing the resolution changes the horizontal resolution, it does not change the vertical resolution or the proper time taken for a frame to be transmitted. So I think that the reason CIF was working where QVGA was not was because CIF horizontal resolution of 352 does not divide the VGA horizontal resolution of 640, this likely caused something like that the MCU wasn't ready to read in the next line and so each alternate line was fixed. This is just a theory however.
6th April 2023
The BoSLcam firmware has been updated to add a secret suffix to the ftp password. This way a hacker with access to the SD card will not be able to view the password in plain text. This change required a modification to the config.txt file to change the password and a line which tells the program to add the suffix to the password. I have added to the option to turn this suffix on and off so as to maintain compatibility with ftp sites which to not take this suffix. The code has also been updated to upload the current battery voltage (in mV).
12th April 2023
rev 1.1.0 of the BoSLcam has been designed. The changes include:
- Added capacity for an LED light. A power switch and pins have been added to turn on and off an LED photo light.
- Set jumper position for SD power to be from the power management IC. This means that the jumper will no longer have to be bridged out of the gate.
- Fixed BOM such that components match the footprints used.
- Deleted battery voltage sense resistors (functionality already provided internally in the nrf9160)
Some photos of the revision 1.1.0 are provided:
I have also released BoSLcam firmware revision 1.0.1 to align with BoSLcam hardware rev1.0.1. This update includes battery voltage and password encryption options. One issue remains that one in every 6 or times the board is turned on, the image byte order will be reversed as displayed in the gallery. Given that the issue only occurs when the board is turned on, it suggests that it has to do with the camera initialisation. The byte order reversal is not the only difference between the two images. One can also see that the reversed image extends all the way to the edge of the frame whereas for the non-inverted image the left most 10 or so pixels appear to be bad data. Which byte order we get shouldn't be an issue so long as I can figure out a way to make the order 100% consistent.
By slowing the rate at which commands were sent to the OV7675 camera, it was found that the byte order could me made consistent and the garbage pixel data on the LHS disappeared. The goal now is to find which command needs some wait time in-between. This is implemented in firmware patch File:BoSLcam firmware rev1.0.2.hex.zip
21 September 2023
I have tried out adding JPEG compression to the images. The results are quite promising. It takes ~6 s for a QVGA image and results in a file and file sizes between 1/2 (quality 3) to 1/5 (quality 2) to 1/30 (quality 1). Overall I'd say that quality 2 offers the best compromise here.
9 November 2023
I have implemented the JPEG compression into a new firmware: File:BoSLcam firmware rev1.1.0.hex.zip This revision adds the new config for selecting JPEG compression. Here is a snippet of the change needed
...
//image_config_t
uint32_t auto_range_time = 1000
enum format = 1 //0 BMP, 1 JPG
//ftp_config_t
char* apn = "hologram"
...
16 November 2023
The SPI SRAM should be upgraded to have larger capacity. This would mean replacing the 1 Mbit 23LCV1024 with something closer to 8 Mbit, yet still low power.
13 February 2024
Two BoSLcam with firmware revision v1.2.1 File:BoSLcam firmware rev1.2.1.hex.zip have been placed in the lab for a long term test. One is set to upload VGA-JPG and the other QVGA-BMP. They have been logging for approximately a week at a 6 minute logging interval without major issue. Today I disconnected the antenna on wdt_qvga in a hope to observe the watchdog timer kicking in and recovery of the BoSLcam, the results of this will be reported in the coming days. For some preliminary results, below are the graphs of the logging gaps and battery voltages against number of logs for both cameras.
Of note is that over the ~1.5k logs only 10 or so were missed and the BoSLcam recovered from each of these. From the gradient of the battery voltage we can find that VGA-JPG image take ~ 0.12 mV/log and QVGA-BMP take ~ 0.07 mV/log (11200 mAh battery). A known issue with this software version is that some lines in the image miss a byte which causes inverted colours. Resolving this issue will need a close look at tightening up the timing of the image readout loop. In total, WDT QVGA-BMP recorded for a total of 7174 images and down to a battery votlage of 3023 mV.
16 February 2024
Three days later plugging in the antenna on QVGA-BMP, the BoSLcam immediately started logging to FTP again. Based on the uploaded status files (I don't want to remove the SD card yet) the BoSLcam kept taking taking and storing photos to the SD card during the period it was offline, hence the WDT didn't need to kick in. Overall, while this test did not test the WDT, it was still a good demonstration of the reliability of the BoSLcam firmware.
19 February 2024
Unlike when using QVGA when using VGA, the image quality can sometimes be affected by the focus of the lens. Thankfully the lens focus can be adjusted by rotating the lens. Clockwise screws it in which makes the focus closer and anti-clockwise moves it out which makes the focus further away. Current the best way to check the focus is via trial and error. I have found that about 1/2 to a full turn of the lens is a good initial step to adjust the focus in. Below are two images taken of the same wall where I have adjusted the focus by a about a 1/2 turn.
20 February 2024
Today I will be working on the LED function for the BoSLcam. Some very rough initial visual tests indicate that to produce a well-illuminated spot at 2 m subtending and angle of 20 deg, ~ 100 mA to 200 mA of current need to be passed through the LED.
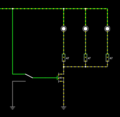
With regard to driving the circuit, I recommend the below as an effective low-complexity option. One drawback of this design is that the LED current will vary by a factor of ~ 2 between a battery voltage of 4.2 V and 3.5 V.
Below are images taken with the BoSLcam where the scene has been illuminated with an LED. I have compared three different LEDs: vishay VLHW5100, cree XQAAWT-02-0000-00000B4E3, osram GW CS8PM1.PM-LRLT-XX52-1. I tested the LEDs at two different currents, 30 mA and 90 mA, both of which are above the maximum forward current however, in a finalised design this current can be divided among multiple LEDs.
Any of the LEDs produce an acceptable image however, I prefer the cree or osram devices as they are SMD and they have a much wider illumination beam which gives them a more uniform image illumination. I think the 30 mA is just a bit too dim and so it will be good to design around a 90 mA current target.
Now it is time to design a PCB for this.
18 March 2024
A PCB was designed, with three CREE XQAAWT-02-000-00000B4E3 LEDs each with their own 49 Ω ballast resistor. With this design, the LEDs draw between 15 to 30 mA when the battery voltage is between 3.7 and 4.2 V. A DMN2310U N-channel mosfet allows the LEDs to be switched on and off from any of the GPIO on the BoSLcam.
I have also incorporated these components directly onto rev1.2.0 of the BoSLcam. Some care was taken to place the LEDs a few mm away and behind the camera so as to minimise the lens flare.
22 April 2024
As of firmware revision v1.4.0 the status file format is given as:
DATE-TIME, TIME_SOURCE, CAPTURE_NO, BATTERY_mV, MCCMNC, RSRQ, RSRP
So the log:
2024/03/22-01:44:27 UTC,NETWORK_TIME,11,4175,310260,13,45
means:
DATE-TIME:     2024/03/22-01:44:27 UTC
TIME_SOURCE:   NETWORK_TIME           (time obtained from the network)
CAPTURE_NO:    11                     (number of images since last reset)
BATTERY_mV:    4175                   (battery voltage (mV))
MCCMNC:        310260                 (the current network operator MCCMNC code)
RSRQ:          13                     (reference signal recieved power)
RSRP:          45                     (reference signal recieved quality)
2 May 2024
The BoSLcam rev1.2.0 have arrived. They have been preprogramed with modem firmware v1.3.2 and application firmware v1.4.0, as such they just need a SD card, sim card, and ov7675. No soldering is required anymore!
15 May 2024
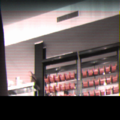
As a further test of the inbuilt LED flash function, a BoSLcam was set up in the den. The picture in the gallery below was taken with the full VGA image resolution and was solely illuminated by the builtin LED flash. The wall was 2 m at its closest point to the camera and 3 m at its furthest. A comparison image is also provided with the LEDs turned off. It is fairly clear that the LEDs improve the ability of the BoSLcam to take images without an ambient light source. It seems that during this test the BoSLcam died of low-signal strength, however it was able to recover a day later via the WDT. A good test of the feature!


