Difference between revisions of "Out of Water Vel Sensor"
| (27 intermediate revisions by the same user not shown) | |||
| Line 64: | Line 64: | ||
We intend to investigate an alternative circuit for using the HB100 sensor. The Gravity Microwave Sensor is hardwired as a motion detector for human and other physical objects, not water velocity. We'll need a more versatile platform to experiment with in order to develop a sensor for measuring water velocity. For this reason, we will be building a custom circuit. | We intend to investigate an alternative circuit for using the HB100 sensor. The Gravity Microwave Sensor is hardwired as a motion detector for human and other physical objects, not water velocity. We'll need a more versatile platform to experiment with in order to develop a sensor for measuring water velocity. For this reason, we will be building a custom circuit. | ||
| + | |||
| + | == 10th February 2020== | ||
| + | |||
| + | Rather than using the motion detector, which has a digital output with non-customizable componentry, a custom amplification and band pass filter was built to communicate with the HB100 sensor directly. In particular, the motion detector is calibrated to detect human motion, and has hardwired components which cannot be modified easily. This is not directly applicable to our application, so we decided to make some changes. | ||
| + | We used a new circuit from the documentation for the HB100 sensor. Testing with this new circuit gave more consistent measurements for tracking voltages. There were previously some issues with the motion detector, particularly with the sensitivity toggle giving unpredictable results and picking up noise. Noise seems to have reduced with this new set-up. | ||
| + | |||
| + | == 11th February 2020== | ||
| + | |||
| + | Today, further testing was done with the new amplification circuit. Various methods of extrapolating the velocity signal from the sensor were tried. | ||
| + | |||
| + | The sensor was used to detect flowing water in a PVC pipe (an identical setup to before). The pipe could be angled more steeply to increase the velocity of water flowing through it. | ||
| + | With the new sensor, motion could be detected when the sensor was more than 25cm away from the pipe. Readings could be made at around 1m away from the pipe, which is a significant improvement in terms of sensitivity. | ||
| + | |||
| + | After taking the raw data using the sensor, it was post-processed to try and determine the velocity of the water. Several methods were used to do this. | ||
| + | The output of the circuit takes the form of an analog signal which oscillates around 2.5V, and clips at around 4V when a large amount of motion is detected. | ||
| + | |||
| + | |||
| + | [[File:Pipe4steep1.png|400px]] | ||
| + | |||
| + | |||
| + | |||
| + | Initially, a peak-counting method was used for the data. This yielded a consistently good result for close measurements; a steeper pipe always had a higher extrapolated velocity reading. | ||
| + | For this method, whenever the signal went above 3.9V, it was counted as a peak. The frequency of the signal was extrapolated from that which allowed velocity to be calculated. | ||
| + | |||
| + | For data where the sensor was further away from the pipe (even at around 25cm), the sensor couldn’t pick up as much of a signal and the clipping no longer consistently occurred. This meant that the above method would register a lower velocity as distance increased. | ||
| + | |||
| + | |||
| + | [[File:Pipe4steep2.png|400px]] | ||
| + | |||
| + | |||
| + | A FFT was used to find the most dominant frequency of the data and that was used to find the velocity. Two different methods were used to find the dominant frequency. | ||
| + | For one method, the maximum frequency point was used and simply assumed to be the dominant frequency. For the other method, the amplitudes of adjacent frequencies were summed together in bins, and the largest bin was chosen as having the dominant frequency. These gave different measurements for the behaviour of the FFTs. Below, the orange line indicates the ‘bins’ method for finding the dominant frequency. | ||
| + | |||
| + | [[File:FFTexample.png|400px]] | ||
| + | |||
| + | The maximum frequency point, in this case, is a 50Hz outlier which we assume corresponds to noise from mains wiring. This noise has quite a substantial profile particularly when signal strength decreases with higher pipe-sensor distances. Mains noise may be a problem if an FFT is not used to find velocity. This may require more investigation. | ||
| + | The maximum frequency point method can nonetheless be used when the amplitude of the signal is strong with smaller pipe-sensor distances. | ||
| + | |||
| + | These methods involving the FFT worked more consistently for larger distance measurements, but there was still too much variation in the FFTs which yielded unpredictable results. It appears as though the hardware needs improvement instead. | ||
| + | |||
| + | == 12th February 2020== | ||
| + | |||
| + | The IF terminal of the HB100 sensor outputs the doppler signal with very small amplitude. It has a constant -70mV signal which fluctuates by around 50mV when motion is detected by the sensor. | ||
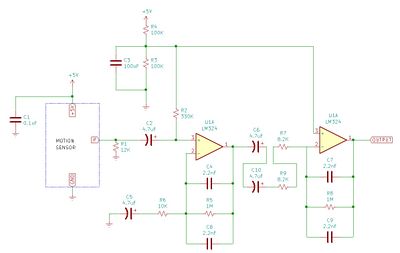
| + | The new amplification circuit uses two band-pass filters set-up in series. | ||
| + | |||
| + | [[File:Doccircuit.jpg|400px]] | ||
| + | |||
| + | Extra componentry helps regulate the amplified voltage of the IF terminal to a DC signal of 2.5V and helps reduced noise generated in the circuit. | ||
| + | The band-pass filters are set to have edge doppler frequencies 3Hz and 72Hz, which corresponds to velocities between 0.05m/s to 1.0m/s. Despite this, the filters have a very shallow decay slope so velocities which are outside this range can still be measured. Thus, these filters were slightly modified to use a narrower frequency band which would allow us to remove more noise from the signal. | ||
| + | The amplification of the op-amps was also increased to see if this would result in consistent clipping of the signal over a longer measuring distance, which would allow for the initial peak-counting method to be used. | ||
| + | This seems to have given better results for the peak-counting method, but unfortunately, the noise signal was not reduced substantially enough by the band-pass filters to allow us to amplify the signal further for larger distances. The amplification from the sensor was reduced back to the documentation circuit. | ||
| + | The narrower frequency range from the band-pass filters seems to have made a positive impact on measurement accuracy, so this change will be used for further testing. The circuit we will be using subsequently is shown below. Note that the capacitance in the band-pass filters has increased, such that the doppler frequency range is between 3Hz and 36Hz, which corresponds to velocities between 0.05m/s to 0.52m/s. | ||
| + | |||
| + | [[File:Editcircuit.jpg|400px]] | ||
| + | |||
| + | == 13th February 2020== | ||
| + | |||
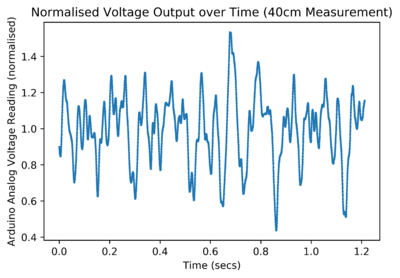
| + | A new method was devised for post-processing the raw data. The signal from the circuit was normalised and all peaks that are higher than a threshold normalised voltage were counted as using the peak-counting method to find velocity. For the closest measurements, 1.4 was used as the threshold normalised voltage, which gave velocities that increased with increasing pipe steepness. For other distances from the pipe, a good qualitative comparison between pipe angles was also observed using a lower threshold normalised voltage. The threshold voltage had to be reduced, as with longer distances from the pipe, the spread of normalised voltage readings actually decreases as well. With appropriate calibration, this means we can measure velocity differences for constant pipe-sensor geometries. Further experimentation can be made with calibrating for different distances/angles between the pipe and sensor. | ||
| + | |||
| + | [[File:Pipe4normalisedsteep1.png|400px]] | ||
| + | [[File:Pipe4normalisedsteep3.png|400px]] | ||
| + | |||
| + | Distance, angle, mass flow rate and water velocity all contribute to the sensor giving variable readings. Noise is also quite substantial from power outlets, even when no human movement is detected, which can throw off readings and give misleading results. Further experimentation will have to heavily regulate all controlled variables to isolate the water velocity reading. | ||
| + | |||
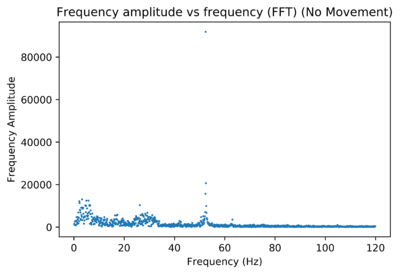
| + | The noise signal from the sensor circuit in an empty room with no movement was more carefully analysed. An FFT shows that there is a substantial 50Hz noise frequency. | ||
| + | |||
| + | [[File:Nomovement.png|400px]] | ||
| + | |||
| + | The narrowing of the band-pass filters reduced the noise amplitude, as was seen in the FFT. Meanwhile, this left no noticeable changes to the signal strength. | ||
| + | The new method was adapted to count all peaks with a threshold voltage reading of 1. This would mean that the standard deviation of the signal strength (which changes with water-sensor distance) could be ignored. Taking these results gives velocity readings which don’t fluctuate much with water-sensor distance, but seem to lack precision due to the 50Hz noise. If 50Hz signals could be isolated, then this method could have promising results. Unfortunately, however, this would mean that water flowing with a doppler shift of 50Hz (which corresponds to 0.7m/s) wouldn’t be possible to measure. This will be explored further. | ||
| + | |||
| + | A better set-up with a small flume will allow us to explore the behaviour of the sensor when the water velocity-sensor angle changes. Beforehand, sensor angle was merely a controlled variable, but now it can be properly explored. | ||
| + | |||
| + | == 17th February 2020== | ||
| + | |||
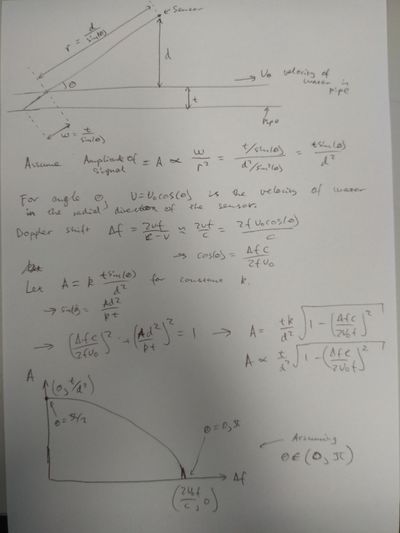
| + | More theory was done on the sensor. Previously, the angle of the sensor relative to the water flow was kept constant to avoid dealing with the additional variability due to changes in angle. The relative magnitude of water velocity measurements should be preserved by this assumption. | ||
| + | |||
| + | Today we delved a little into the angular variability: | ||
| + | |||
| + | [[File:Sensor_Theory.jpg|400px]] | ||
| + | |||
| + | This theory indicates that the end of the Fourier Transform peak rather than the top of the peak is more significant as a gauge of flow velocity. | ||
| + | |||
| + | More testing was done in the small flume. The water flowing in the flume was adjusted to have a constant height along the direction of flow. Given that the water volume flow rate through the pipe is constant, the height of the flowing water should be inversely proportional to the velocity of the water. | ||
| + | |||
| + | Due to the small amount of water in the flume, inserting the (rather bulky) FloMate probe into the water disturbed the flow. Only one velocity measurement was needed to determine the water velocity for all water heights. A large velocity was used to take this measurement, as with lower velocities the probe disturbed the flow more. The velocity of water was approximately 1.1m/s when the height of water in the flume was 16.5mm. This measurement is probably quite unprecise, but any mistake in this value simply means the calibration factor will be wrong, and won't affect the relative magnitude of velocity measurements for different water heights. | ||
| + | |||
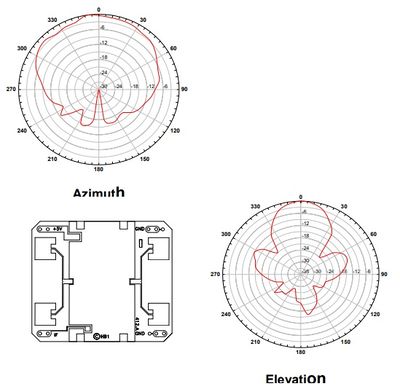
| + | The sensor was placed on top of the flume and rotated such that the more or less stable-signal-strength-angles -60 to 60 degree in the azimuthal direction pointed at the water. This gives the closest possible link between to the theory, which assumes that the signal is stable across all angular directions. | ||
| + | |||
| + | [[File:Sensor_angle.jpg|400px]] | ||
| + | |||
| + | <small>Source: https://www.limpkin.fr/public/HB100/HB100_Microwave_Sensor_Application_Note.pdf</small> | ||
| + | |||
| + | |||
| + | The height of the flowing water was varied and the sensor data was taken whilst ensuring that the sensor did not move. | ||
| + | The end of the peak for all the heights was approximated by eye. This gave a good qualitative correlation between doppler frequency at the end of the peak and velocity. However, the approximated end-of-peaks doppler frequencies undoubtedly had a large degree of error in them. | ||
| + | |||
| + | [[File:dopplershift_vs_velocity.png|400px]] | ||
| + | |||
| + | |||
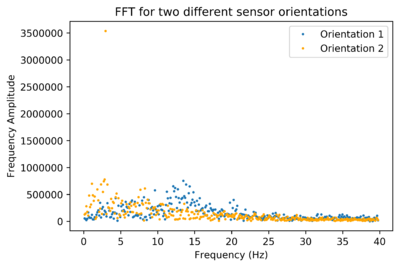
| + | Subsequently, measurements were taken for the same water velocity but with varying sensor positions. It was found that the angle of the sensor significantly affected the position and distribution of the peaks. For example, the following graph depicts two sets of measurements in between which the only change was that the sensor was rotated by 90 degrees in a vertical axis (in both cases, the sensor was lying flat on top of the flume) | ||
| + | |||
| + | [[File:FFT_two_orientations.png|400px]] | ||
| + | |||
| + | Here is the same graph but with the data for orientation 1 shifted up (for improved visibility) | ||
| + | |||
| + | [[File:FFT_two_orientations_(shifted).png|400px]] | ||
| + | |||
| + | This shows that due to the different sensitivities for different angles, the sensor most likely produces a peak based on the direction it is facing. I.e. If the rather pointy sensitivity maximum from -20 to 20 degrees in the elevation direction are pointed at a particular section of water, then the Doppler shift frequency of that water will be very strongly exaggerated in the FFT. | ||
| + | |||
| + | Using a peak-counting method to determine the velocity of these two orientations also gave vastly different results. | ||
| + | |||
| + | == 18th February 2020== | ||
| + | |||
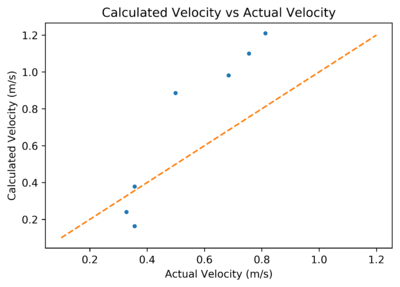
| + | Yesterday’s data was processed using a peak-counting method as well. This gave a reasonable correlation. | ||
| + | |||
| + | [[File:peaks_vs_velocity.png|400px]] | ||
| + | |||
| + | The orange line has slope around 0.14, such that actual velocity is around 7 times higher than the predicted value using peak-counting. No post-processing computational flaws were found, so it is suspected that the sensor itself is giving unexpected results. Part of this factor may be due to a larger angle ‘theta’ from yesterday’s theory, but it is doubted that this would scale velocity down by a factor of 7. A calibration curve may enable us to ignore this peculiarity; it is hoped that this problem arises since we are detecting water rather than physical objects and not due to the geometry of the small flume. If this is caused by the small flume’s geometry, then the sensor may be intrinsically inadequate for the required application, so further testing with different flume geometries to investigate this will be required. | ||
| + | |||
| + | This graph is likely a useful alternative to the end-of-peak method used for the prior graph, as it is computationally much easier. There is a strong correlation in the behaviour of either method for finding velocity, which hopefully indicates that both methods are viable. In either case, the lowest calculated-velocity point has an unusually high measured velocity. This is undoubtedly due to the positioning of the sensor in relation to the flume: The sensor was positioned on top of the flume, so higher water heights (which corresponded to lower water velocities) had flowing water much closer to the sensor. Referring to the theory from yesterday, this means that the angle ‘theta’ is on average smaller for the measurements, which yields a higher calculated velocity. Positioning the sensor below the flume is not an option due to the metal framing of the flume. For subsequent measurements, the sensor will be positioned above the flume at a variable height such that the sensor-water distance is constant. Additionally, a 3D printed case will be used to point the sensor at the water at the right angle. | ||
| + | Satisfyingly, the 3 highest velocity points have a good linear relationship between actual velocity and measured velocity. Seeing as how they have similar actual velocity and therefore similar height of water, it makes sense that the angle ‘theta’ is similar so there is little uncertainty. Nonetheless, the 4th highest velocity point, which is grouped close to the 3 highest velocity points, unexpectedly has a much lower measured velocity than it should. The reason for this could be the nature of the water flow in the flume: For small heights of water, the water could be regulated to flow at a constant height, but for slightly higher water heights, the water could start forming waves and becoming turbulent. This may have been a problem that went unnoticed for this measurement. Ultimately, the small flume is not an entirely ideal testing environment and full-PVC-pipe conditions are needed to adequately use the sensor. | ||
| + | |||
| + | |||
| + | The circuit which was used from the documentation has peak frequency corresponding to the velocity of human motion. Measuring water velocity with varied sensor angles throws off any calibration factors between peak frequency and velocity. As such, it is reasonable to reduce the amplification of the op amp so that the voltage never limits to the maximum and then to count all peaks which are above some custom-chosen threshold value. Since we are counting peaks, the resolution of the readings aren’t really important anyways. The new circuit shown below reduces the amplification power of the second op amp, which will allow us to see a greater range of voltage values and to be able to better process the output data through a FFT or for peak-counting. This circuit will be used in the subsequent set of velocity measurements in the small flume. | ||
| + | |||
| + | [[File:Editcircuit2.jpg|400px]] | ||
| + | |||
| + | |||
| + | == 19th February 2020== | ||
| + | |||
| + | Further tests were done with the revised set-up; the circuit was changed, a 3D printed case was used, and the height of the sensor above the flume was varied so that the distance between the sensor and water surface remained roughly constant within +-5mm. Overall, this seems to have given better results when using a peak-counting method. | ||
| + | |||
| + | [[File:peaks_vs_velocity2.png|400px]] | ||
| + | |||
| + | Varying the height of the sensor seemed to have the expected effect, although the rather short length of the flume may mean that varying height can expose the sensor to detect more turbulent water motion at the front and end of the flume. This means that changing sensor height is not affecting just one variable. | ||
| + | |||
| + | With today’s tests, it was observed that the lowest measured water velocity had an unexpectedly high calculated water velocity – just as in the previous tests. This is most likely due to the nature of the flume; with increasing water height, more turbulent water motion at either end of the flume may create high-moving air bubbles which the sensor will detect. This effect seemed more prominent at the start of the flume: By positioning the sensor in three different points along the length of the flume for constant water motion, from beginning, middle to end, water velocities of 0.064m/s, 0.049m/s and 0.055m/s were detected, respectively. This supports the theory. Visibly, there were more air bubbles at the beginning of the flume as well. | ||
| + | This raises the concern that the sensitivity of the sensor may be affected by how many air bubbles are trapped in the flowing water, or also by factors such as the turbidity of the water. | ||
| + | |||
| + | == 21st February 2020== | ||
| + | |||
| + | Development of the microwave sensor has been put on hold while an appropriate testing environment is built to enable more reliable data collection. The small flume demonstrated the viability of the sensor for determining a calibration curve to measure high water velocities, but for lower water velocities, the physical design of the small flume prevents appropriate testing. With the new testing environment, any other drawbacks or features of the microwave sensor will also become more apparent. | ||
| + | Velocity measurements around 0.7m/s haven’t been measured, which is exactly the velocity that corresponds to a 50Hz doppler shift. These measurements may be interfered by the 50Hz noise from mains wiring. Removing this noise, in particular, would really decrease noise picked up by the sensor (an FFT shows that the 50Hz noise is a very dominant signal picked up by the sensor in an empty room). A method for removing the noise would be finding the FFT of signal, removing frequencies at 50Hz, then taking an inverse FFT and counting peaks. The mains wiring noise takes up a quite narrow frequency domain in an FFT and removing signals from 51-53Hz (or rather, setting all frequencies from 51-53Hz to be the average of surrounding frequencies) would remove essentially all mains wiring noise while seemingly leaving all frequencies which correspond to the sensor output unaffected (as these signals have a much wider range of frequencies). The inverse FFT does indeed appear to have less noise and have less sporadic peaks. | ||
| + | Once the new testing environment is built, and 0.7m/s flows can be measured, this method can be further explored. At the moment, the geometry of the sensor/flume likely plays a much larger role in causing error. Additionally, this method may be quite computational if frequent velocity measurements are required. | ||
| + | |||
| + | == 25th February 2020== | ||
| + | |||
| + | Ultrasonic sensors have been utilised to transmit and receive a 1MHz signal. A (quite noisy) 1MHz signal is generated by the Arduino, before being smoothed out by a series of low pass filters. This signal is fed into an op-amp to amplify it and to create a more stable driving voltage for the transmitting transducer. | ||
| + | |||
| + | [[File:Prelim_Circuit.jpg|400px]] | ||
| + | |||
| + | The receiving transducer detects a noisy signal. 1MHz spikes occur at regular intervals which most likely correspond to the sporadic 1MHz signal that the Arduino outputs (this can be removed by using a 1MHz crystal in place of the Arduino). | ||
| + | |||
| + | [[File:Null.jpg|400px]] | ||
| + | |||
| + | This is passed through a low pass filter to isolate the 1MHz signal received from the transmitting transducer. Pictured below is the output of the receiving transducer when the transmitting and receiving transducers are pressed against one another. The signal is very clear, but quite small (in the order of 120mVpp). | ||
| + | |||
| + | [[File:Tranducer_Signal.jpg|400px]] | ||
| + | |||
| + | However, any received ultrasound signal that has travelled through a pipe (rather than in direct contact) will likely be of a very small amplitude with a low signal to noise ratio. Conventional out of water ultrasonic flow velocity sensors transmit and detect a customised (variable amplitude) 1MHz ultrasonic pulse, which would allow very precise TOF measurements. This, however, would require very high signal to noise ratios which may be difficult to achieve using low power (which causes lower transducer amplitude), low sampling rate Arduinos (which cannot sample at 1MHz). While certain high-frequency chips could make this possible, it is unclear if this is realistically feasible. | ||
| + | |||
| + | For this reason, it is hoped that instead, the amplitude of the 1MHz signal can be observed and that when this reaches a threshold value, then the TOF of the ultrasonic wave can be measured. The Arduino lacks the precision to calculate TOF to the required precision, so a TOF chip, such as the TDC7200 (which has 55ps precision) will be used to detect accurately the TOF. | ||
| + | |||
| + | An envelope demodulator circuit (or simply a diode) paired with an op-amp should give very good amplitude readings to the Arduino when the transducers are in contact (which will be fed into the TDC7200). With actual measurement conditions, low pass filters can only be used to block out noise above 1MHz, which may prevent good measurements. For this reason, a mixer may be used in the form of a narrow band-pass filter for signals close to 1MHz: After passing the signal through the mixer and through a low pass filter, the doppler shift frequency is found. Amplifying this with an op amp and calculating its amplitude will allow us to trigger the TDC7200 once the doppler amplitude passes a threshold voltage. This method may simultaneously give an alternative avenue of measuring velocity through the doppler shift as well. | ||
| + | |||
| + | == 27th February 2020== | ||
| + | |||
| + | The transmission of the ultrasound through a PVC pipe were investigated. A PVC pipe was filled with water, and the transmitting and receiving transducers were clamped tightly onto either side of the pipe, directly opposite one another. No observable signal could be detected. | ||
| + | Clamping two transducers to either side of one side of the PVC pipe gave a very small reading, around 10-20mVpp. | ||
| + | When positioned in a sink filled with water, the transducers produced a very strong signal when pointed at each other. Reflection from the metal sides of the sink was also very prominent, which suggests that a very small fraction of the signal is transmitted through the water-metal boundary with virtually all the ultrasound being reflected. | ||
| + | Clearly, the transmission of the ultrasound through the pipe needs to be increased. | ||
| + | |||
| + | The amount of transmission occurring through two mediums depends on the acoustic impedance of either material. The proportion of sound intensity being transmitted is equal to 4*z_2*z_1/(z_1+z_2)^2. | ||
| + | PVC and water have similar acoustic impedances; 3.27 MPa*s/m^3 and 1.483 MPa*s/m^3, which gives a transmission coefficient of 0.86. This suggests that for transmission through the PVC pipe should yield an overall transmission of 0.86^2 ~ 0.74 for the two water-PVC transmission boundaries. Ignoring the attenuation of the signal due to transmission through the water/PVC, the only other signal loses should be due to the transmission boundary between transducer and PVC. Even small amounts of air can completely disrupt the transmission (as air has a much lower acoustic impedance). Medical ultrasound uses an impedance-matching fluid between the transducer and the patient; similarly we will need to find a material that has acoustic impedance between that of the PVC (or metal pipe material) and the transducer that will help increase the amount of signal transmission. This material will be tightly clamped between the transducer and pipe and will have a circular shape that matches the pipe’s curvature to maximise surface contact area. Ideally, this material will have non-uniform acoustic impedance that changes from 2.9 (which is probably close to the acoustic impedance of the transducer) to 1.483 (the acoustic impedance of the PVC). If a supplier of something like this can be found, this would maximize the transmission. Alternatively, a material which has an acoustic impedance somewhere between 2.9 and 1.483 (a bit of maths shows that 2.07 is optimal and gives a transmission coefficient of 94.5%) can be placed in between the two surfaces, which would also improve transmission. | ||
| + | |||
| + | == 2nd March 2020== | ||
| + | |||
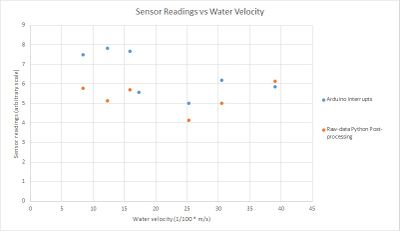
| + | Testing was done with measuring the velocity of water in the large flume with the Microwave Doppler Shift sensor. In the first series of measurements, the sensor was placed, stationary above the large flume, and was sloped at a 45 degree angle using the 3D printed case (theoretically, this maximises the spread of the sensor’s detection angle at the water). The velocity of the water in the flume was varied between 0.1-0.4 m/s by lifting and lowering the flume’s exit channel. This varied the height of water in the flume and therefore varied the velocity of water. For each water velocity, measurements were taken with the microwave sensor after the water reached a stable height/velocity. Velocity was recorded using the velocity probe, although it should also be possible find velocity using the height of water in the flume (perhaps the water velocity is not uniform and the velocity probe gives incorrect velocity readings and this could double-check that everything is in order). | ||
| + | The microwave sensor was used to find velocity using both a peak-counting method (using interrupts in the Arduino), and through post-processing the raw sensor data in Python. Separate trials were used for each set of measurements as interrupts would very likely disrupt measurements of the raw sensor data. | ||
| + | The readings that were found give no correlation between microwave sensor readings and the flowmeter velocity. | ||
| + | |||
| + | [[File:ReadingsvsVelocity_LargeFlume.jpg|400px]] | ||
| + | |||
| + | Analysing the raw sensor data reveals that as the velocity of the water increased, the amplitude of the sensor data appears to decrease. This is most likely due to the water height dropping such that the water is further away from the sensor. This, of course, decreases the frequency with which the signal reaches the threshold voltage value such that a peak is counted using the interrupt method. | ||
| + | Post-processing the data in Python and using the peak of FFT’s to gauge velocity doesn’t produce promising results either. As can be inferred from the raw sensor data incurring a noticeable change in amplitude due to a larger height difference between the water and the sensor, the sensor has a quite short range of detection for water. Thus, changing the height of the sensor above the water may also change the angle of the sensor’s detection of the water, which would decrease the frequency of the sensor’s readings, which again, would decrease the velocity extrapolated from the sensor. | ||
| + | |||
| + | |||
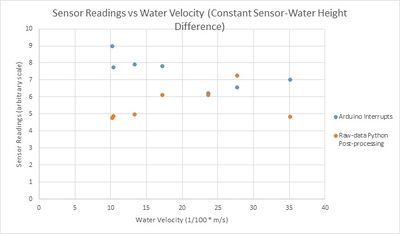
| + | The tests were repeated whilst keeping the sensor at a constant height above the water. Boxes and polystyrene sheets (which shouldn’t affect sensor readings) were placed under the sensor to maintain a constant sensor-water height difference within +-0.5cm. | ||
| + | |||
| + | [[File:ReadingsvsVelocity_LargeFlume_ConstHeight.jpg|400px]] | ||
| + | |||
| + | These readings similarly give no correlation for peak-counting. Another factor which could contribute to this error is the smaller amount of water when the water height is low (high water velocity). This would mean that there is a smaller amount of particles in the water that the microwave radiation could reflect off of, therefore decreasing the frequency of the measurements (the amplitude of the signal appears to be more consistent for different water velocities for this set of measurements – which supports the idea that height difference did indeed cause error for the previous set of measurements). | ||
| + | For post-processing with Python, there appears to be a trend in the first few data points, but for the last measurement the sensor velocity drops very suddenly. This may be due to the reduced amount of water in the flume; this has given a much more lopsided FFT transform for this particular datapoint, which may be explained by the theory discussed on the 17th of Feb (that the end of the FFT rather than the peak of the FFT corresponds more to velocity). | ||
| + | This data will be re-analyzed with using the end of the FFT to find velocity, which will potentially give a better correlation. | ||
| + | |||
| + | == 6th March 2020== | ||
| + | |||
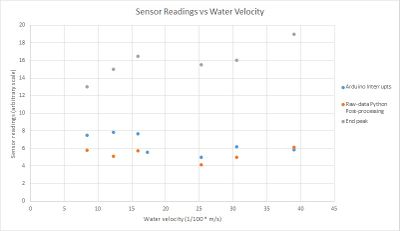
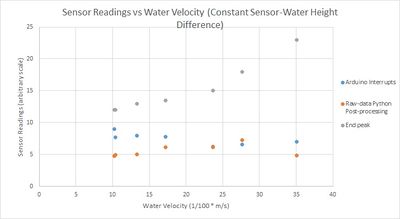
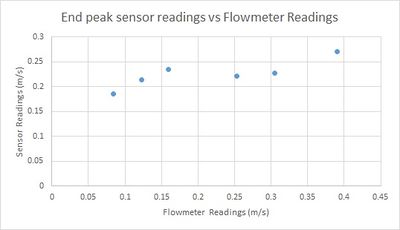
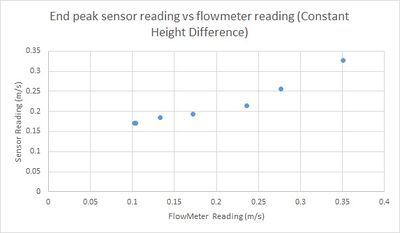
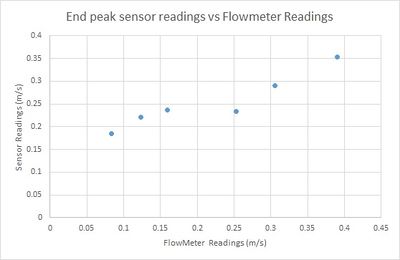
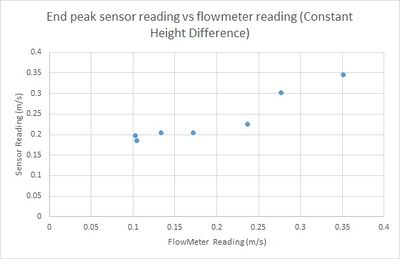
| + | Using the frequency corresponding to the end of FFT peak gives much more promising results for both sets of measurements. | ||
| + | |||
| + | [[File:ReadingsvsVelocity_LargeFlume+Endpeak.jpg|400px]] | ||
| + | [[File:ReadingsvsVelocity_LargeFlume_ConstHeight+Endpeak.jpg|400px]] | ||
| + | |||
| + | These results also give velocity readings which are quite well scaled relative to the actual velocity (i.e. Using the formula for converting doppler shift to velocity). | ||
| + | |||
| + | [[File:Endpeak.jpg|400px]] | ||
| + | [[File:ConstHeight_Endpeak.jpg|400px]] | ||
| + | |||
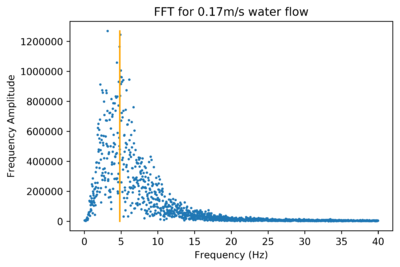
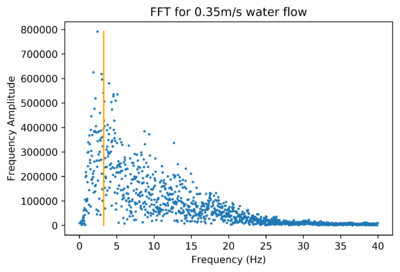
| + | The fact that this method gives a good correlation actually suggests that using the peak of an FFT or using a peak-counting method may be infeasible. Consider the following two FFT’s for two different water flow speeds. | ||
| + | |||
| + | [[File:FFT_Slow_flow.png|400px]] | ||
| + | [[File:FFT_Fast_flow.png|400px]] | ||
| + | |||
| + | The peak of the slow water flow has a higher peak-doppler-shift-frequency (corresponding to higher water velocity) than the fast water flow; which gives inaccurate results. The end of the peak for the slow water flow (taken to be around 13.5Hz), however, is at a much smaller frequency than that of the fast water flow FFT (taken to be around 23Hz). This shows that the width and lopsidedness of an FFT relates to the velocity reading. In particular, since the peak of the FFT also corresponds to the peak-counting frequency, these two methods for finding velocity don’t account for the width of the FFT for finding velocity, which should be vital information for finding velocity. | ||
| + | |||
| + | == 9th March 2020== | ||
| + | |||
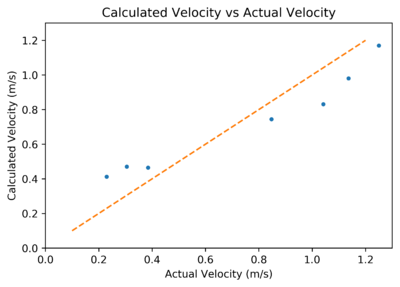
| + | To ensure that the end of peak is can be more systematically found, an algorithm was built to determine the doppler shift frequency at the end of the peak. This produces a good correlation between calculated and measured velocity for the large flume measurements. | ||
| + | |||
| + | [[File:Endpeak_auto.jpg|400px]] | ||
| + | [[File:ConstHeight_Endpeak_auto.jpg|400px]] | ||
| + | |||
| + | Largely, this gives similar results to when the end of the peak was found by eye. | ||
| + | |||
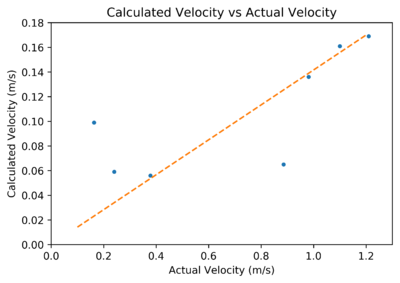
| + | As the large flume is currently inaccessible, measurements were using the small flume were used to check the validity of the end-of-peak algorithm. Measurements were taken using a constant sensor-water height difference. This measured data was processed by applying the same end-of-peak algorithm on this data, and a good correlation was found between actual velocity and sensor velocity. | ||
| + | |||
| + | [[File:auto_vs_velocity.png|400px]] | ||
| + | |||
| + | Further testing with the transducers reveals that a clear signal can be observed for transmission through a water-filled plastic beaker, whilst transmission through the same geometry with a PVC pipe filled with water yields no transmitted signal. The acoustic impedance of PVC is 3.27 MPa*s/m^3 while the acoustic impedance of the plastic beaker is likely around 2.40 MPa*s/m^3. This difference in acoustic impedance should not yield such a drastic difference in ultrasound transmission. It is thought that the more flexible plastic beaker can be bent to have more surface contact with the transducer which would allow a much stronger signal to be transmitted through the pipe. | ||
| + | Covering the transducers with a few droplets of water also helps transmission through the plastic beaker; the water displaces more air between the transducer and pipe surfaces which reduces the ultrasound attenuation due to any air-solid boundaries. | ||
| + | Even though water has an acoustic impedance which is lower than both the transducer and the pipe surface, its function to displace air significantly improves transmission. This suggests that any malleable rubber or silicone, regardless of acoustic impedance, would increase transmission. | ||
| + | |||
| + | == 10th March 2020== | ||
| + | |||
| + | Some more experimentation was done with the microwave sensor. As we are interested in finding the FFT of the microwave sensor data, it is thought that if the raw microwave data is not in the form of a square wave, but instead has a smooth shape, this may result in less noise in the final FFT. In particular, larger frequencies may add up together to increase the length of the FFT, which would reduce the precision of the end of peak method. The raw data comes in the form of a square wave due to the op-amp being limited by the power supply of the Arduino. By reducing the amplification through the op-amp, it would be possible to avoid these peaks from forming, which would allow for less noise to occur. | ||
| + | The amplification of the 2nd op-amp was reduced by changing the ratio of resistances whilst keeping the RC value unchanged. | ||
| + | |||
| + | == 13th March 2020== | ||
| + | |||
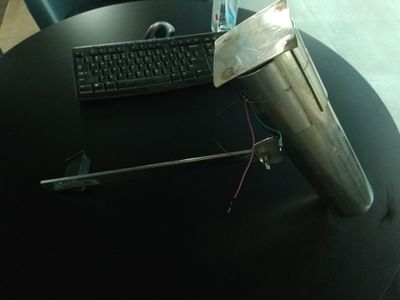
| + | Due to the large detection angle of the microwave sensor, the end of FFT peak frequency relies on the sensor detecting water velocity through a very shallow angle. To make the sensor work without a shallow detection angle and to also reduce the noise that the sensor detects, a pipe was built to house the sensor to direct the microwaves at a specific angle at the water. | ||
| + | This will allow us to measure only one Doppler shift frequency rather than a spectrum, such that the FFT should have a very clear peak frequency which would directly correlate to the water velocity. | ||
| + | |||
| + | [[File:Pipe.jpg|400px]] | ||
| + | |||
| + | In the picture above, the microwave sensor is placed at the very top of the metal pipe. The bottom end of the metal pipe is not blocked off, such that the microwaves are all focussed towards the bottom end of the pipe. Three wires which are connected to the microwave sensor inside the pipe come out of the top of the pipe, and are ready to be interfaced with more circuitry and an Arduino. | ||
| + | Some issues were found with the sensor housing; the sensor detects movement through the welds in between the top plate and the pipe body, as well as the hole through which the wires enter the pipe. Additionally, diffraction occurs out the open end of the pipe, such that the microwaves aren’t all focussed on one angle, but will rather detect a small range of angles. Hopefully this diffraction will not be significant enough to cause issues. | ||
| + | |||
| + | == 19th March 2020== | ||
| + | |||
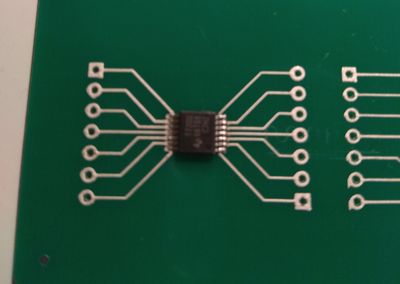
| + | Some of the components required for the ultrasonic out of water flowmeter circuit have very small tabs and are therefore not readily accessible for use with an Arduino. A PCB was built to house this componentry. The oscillating crystals and the mixer were mounted adequately, but due to the very small size of the TDC’s tabs, the mounting of the TDC failed. | ||
| + | |||
| + | [[File:Components_PCB.jpg|400px]] | ||
| + | |||
| + | The board will be re-printed and the TDC mounted so that it can also be interfaced for the transducer circuit. | ||
| + | |||
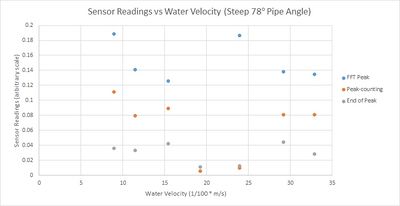
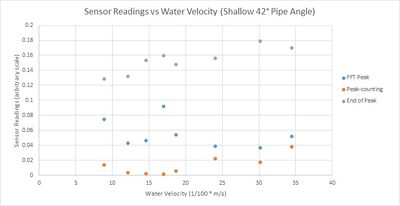
| + | The microwave sensor, placed inside the focussing pipe, was used to take velocity data in the large flume. Velocity information was extrapolated from this data by using the frequency of top of the FFT peak, the end of the FFT peak, and a raw-data peak-counting method. The results for two different angles of pipe are shown in the graphs below. | ||
| + | |||
| + | [[File:Calibrations_Steep_Pipe.jpg|400px]] | ||
| + | [[File:Calibrations_Shallow_Pipe.jpg|400px]] | ||
| + | |||
| + | Every data series in the above two graphs shows no correlation between sensor velocity readings and actual velocity readings, apart from the end-of-peak data set in the shallow pipe experiment. As the end of peak method relies on the sensor detecting water flow at a very shallow angle to the water flow, this suggests that the pipe doesn’t focus the microwave beam and that too much diffraction occurs from the mouth of the pipe. This also explains why the other data series show no correlation. | ||
| + | The pipe is already quite wide, but the wavelength of the microwaves (around 2.85cm) is too long to avoid diffraction. Instead of using a pipe a different shape could focus microwaves more effectively, but the rather long wavelength of the microwaves means that any focussing device would need to be quite large. Moreover, the microwave beam is required to be very focussed, which might mean that the focussing device would need to be even larger. | ||
| + | More investigation will be done to determine the optimal shape for a focussing device and whether it could feasibly work for this particular function. | ||
| + | |||
| + | == 25th March 2020== | ||
| + | |||
| + | A PCB was built for housing the TDC for the ultrasonic out of water velocity sensor circuit. Using a multimeter shows that no short circuits have occurred, which suggests that the mounting was successful. | ||
| + | |||
| + | [[File:TDC_PCB.jpg|400px]] | ||
| + | |||
| + | A bit of theory was done to better understand the features of the FFT of the microwave sensor data. Further analysis is required, but preliminary results seem to suggest that the frequency of the FFT peak may not actually contain information about the velocity of the water. As such, only peak-counting would be useful to find water velocity if the microwave radiation can be appropriately focussed. | ||
| + | |||
| + | == 27th March 2020== | ||
| + | |||
| + | For velocity measurements for the large flume, the peak of the FFT very rarely leaves the range of 2-6Hz. A 4Hz Doppler Shift corresponds to a water flowrate of 0.06m/s, which is lower than the smallest velocity recorded. This can be explained by the fact that the sensor is most sensitive at an angle that points directly down towards the water surface, where the water velocity radially inwards towards the sensor is quite low, therefore yielding a small Doppler Shift. However, the peak frequency should still theoretically increase and decrease relative to the water flow velocity. This doesn’t occur. | ||
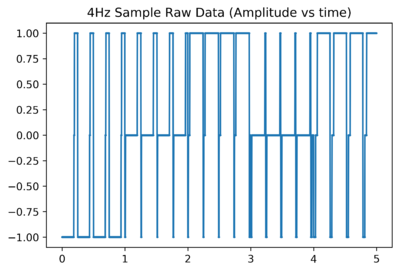
| + | To investigate possible sources of error for this, a sample ‘signal’ was arbitrarily generated which has a frequency of 4Hz on average. The below graph shows a small section of this signal. | ||
| + | |||
| + | [[File:4Hz_Sample_Raw_Data.png|400px]] | ||
| + | |||
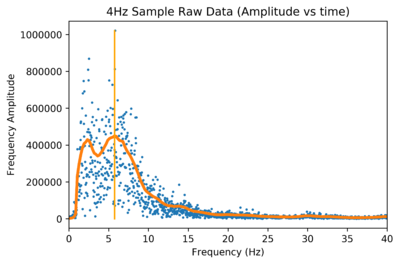
| + | It would be expected that the dominant frequency in the FFT of this signal is 4Hz. 4Hz is indeed a large peak in the FFT, but the absolute dominant frequency is much lower; around 0.38Hz. | ||
| + | |||
| + | [[File:FFT_for_4Hz_Sample_Raw_Data.png|400px]] | ||
| + | |||
| + | This lower frequency occurs simply due to the nature of taking an FFT of stochastic data. The 8Hz frequency peak also stands out; this peak is very likely due to the square wave nature of the sample data, but the possibility that higher frequency peaks can arbitrarily occur should not be neglected. | ||
| + | |||
| + | Using these results, we can infer that lower frequency peaks may unexpectedly occur when taking the FFT of the actual sensor data as well, which would result in a lower peak frequency and water flow velocity being recorded than expected. It is a possibility that the peak doppler shift frequency and this lower frequency are merged together in the actual sensor FFT, so that only one peak is discernible, as these two different closely-spaced peaks mesh together. Rarely, these peaks might not be merged together, such as this FFT of sensor data taken from the large flume: | ||
| + | |||
| + | [[File:Dual_peak_sample.png|400px]] | ||
| + | |||
| + | This theory introduces the idea that there could be no velocity information contained inside the peak frequency in the FFT, which could invalidate this method of finding water velocity. Further investigation may clarify this theory. | ||
Latest revision as of 03:43, 27 March 2020
We are developing a new velocity sensor which we hope will be able to detect the velocity of flowing water when placed outside of a flowing water body. The motivation for this is to ease the installation process, as this would allow the sensors to be installed without the removal of drain covers. The sensor should be capable of penetrating concrete drain covers and detecting the flow of water underneath.
Contents
- 1 21st January 2020
- 2 22nd January 2020
- 3 4th February 2020
- 4 5th February 2020
- 5 7th February 2020
- 6 10th February 2020
- 7 11th February 2020
- 8 12th February 2020
- 9 13th February 2020
- 10 17th February 2020
- 11 18th February 2020
- 12 19th February 2020
- 13 21st February 2020
- 14 25th February 2020
- 15 27th February 2020
- 16 2nd March 2020
- 17 6th March 2020
- 18 9th March 2020
- 19 10th March 2020
- 20 13th March 2020
- 21 19th March 2020
- 22 25th March 2020
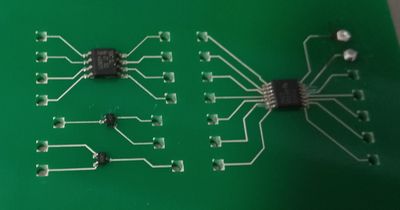
- 23 27th March 2020
21st January 2020
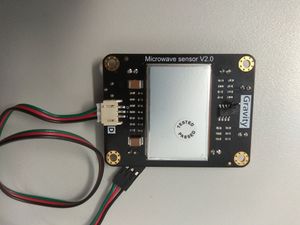
Microwave Doppler shift motion detectors can be sourced very affordably from the internet. Microwaves will readily penetrate thick concrete, but can also be easily blocked using a faraday cage to remove external noise. Our goal is to modify one of these sensors to detect not just motion, but the velocity of motion as well. We are currently using the Gravity Digital Microwave Sensor, which uses a 10.525 GHz microwave source.
The sensor sends out a signal and uses the phase difference between the outgoing and incoming waves due to doppler shift as a measure of velocity. hen a threshold velocity is observed, which is not useful for our application. The sensor outputs a digital high/low signal when a threshold velocity is observed. Our first task is to backtrack through the circuitry of the sensor, to probe the raw measured signal which measures the amplitude of the observed velocity.
By investigating the schematics for the sensor, we found that probing the pin 1 output of the LMV358 op-amp gave us a signal whose amplitude correlates well with velocity. We intend to find a calibration curve which will allow us to relate the amplitude of this signal to velocity.
The data taken below is a measure of the voltage output of the probed velocity sensor data over number of measurements. The measurement frequency is set to 5kHz. While no velocity is observed, the signal floats at around 208 which corresponds to approximately 1V. When agitated, the sensor outputs readings between 0 and 1023, (0-5V). Due to the signal floating at 208, we intend to use the time-averaged absolute difference between the current reading and 208 as a measure of velocity amplitude. Our next task will be remove the noise in the signal. The voltage output reading is clearly bounded by a reading of 1023 (5V). This will create some uncertainty when measuring very high velocities which we will also need to somehow avoid.
22nd January 2020
A low pass filter was integrated into the circuit to remove the high-frequency noise present in the data taking. Further removal of noise was accomplished by taking the weighted sum of the past 40 measurements (with higher priority to the latest measurements). Testing with flowing water will indicate whether or not this has removed enough noise to produce a meaningful calibration curve. We are also investigating toggling the sensitivity of the sensor, and choosing an appropriate material for the faraday cage which will block out external noise.
4th February 2020
As there is still too much noise present in the velocity sensor’s readings, we smoothed out the readings by averaging over a longer interval. Frequent velocity measurements are not required anyway.
The sensor was used to attempt to measure the speed of flowing water in a flume. The sensor was wrapped up in aluminium foil, leaving only one side of the sensor open, which was pointed at the flowing water. Raw sensor data from pin 1 was taken alongside actual water speed measurements using a FloMate probe. Post-processing the raw sensor data shows that unfortunately, no correlation appears between the sensor velocity and FloMate probe.
The strength of the signal from the sensor was quite small, so there was clearly a lot of noise that could have affected measurements. There are several ideas for improving measurements. We will investigate increasing the sensitivity of the sensor (although this could increase noise as well). While using the averaging technique on the signal from pin 1 was useful for measuring the movement of solids, it did not work as well with water. Perhaps we may use an alternative form of measurement by using the frequency of the signal from the sensor's OUTPUT pin as a measure of velocity. We wish to also investigate using alternative breadboards for the sensor. We intend to continue using the HB100 microwave sensor for now, but it may be preferable to use alternative wiring for amplifying the signal from the HB100 sensor. Different breadboards might work better for detecting velocities.
5th February 2020
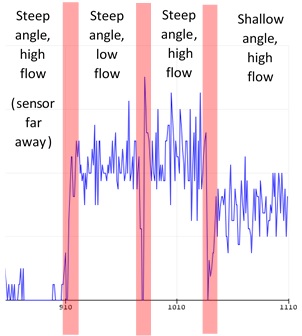
Experimentation was made with detecting the flow of water running through a 90mm diameter PVC pipe. Water flowed from a tap down through the PVC pipe, which was inclined at a variable angle. The following graph shows the relative frequency of motion detections made by the sensor. The horizontal scale is in units of time (each unit is around 0.5 seconds), and depicts various different setup arrangements. Throughout the last three measurements, the sensor was placed directly next to the pipe and was pointed at the pipe. For the first measurement, the sensor was placed roughly 25cm away from the pipe. When there was no flowing water in the pipe, the sensor consistently read a 0 frequency of motion detections
These measurements give us a qualitative understanding of the sensor’s abilities, in particular, that being any more than a mere 25cm away from the pipe gives us no data. The sensitivity was increased to account for this, but it was found that even with slightly increased sensitivity, the sensor was picking up ambient movements. Measurements were also unchanged by turning the flow of water on/off.
We also see that changing the flow of water leaves the detection frequency virtually unchanged, even though the flow of water was changed quite substantially. By carefully toggling the flow of water to be very small, we saw a decrease in the detection frequency, but even this effect was subtle and outweighed by a large amount of noise present in the signal.
Alternatively, using the pin 1 output of the sensor seemed to give a slightly more consistent correlation between average voltage and the angle of the pipe. With increased distance from the pipe, the average voltage signal strength decreased, but still gave consistently good readings at 25cm away from the pipe.
A problem was encountered with the sensor overheating after a long period of intermittent measurements. At this point, the sensor started giving bogus results. I.e. Giving high frequency detection readings when completely alone in a room. The issue is suspected to be either due to reflections from a large amount of aluminium foil covering the sensor (which was used to block ambient noise), or perhaps from some overheating fault.
7th February 2020
Further experimentation was made with shielding the sensor, which seems to have been causing issues. The sensor was wrapped entirely in aluminium foil and packaged together. The readings from the sensor, contrary to expectations fluctuated and depicted a non-zero motion detection frequency. Even a thin sheet of aluminium reflects microwaves very well, so this result was surprising. After carefully re-packaging the sensor and weighing it down tightly to remove any kind of movement of aluminium foil, the sensor read a consistent zero reading. For this reason, it is thought that even small movements of the aluminium foil un-crinkling could cause significant spikes in the sensor's readings and that if aluminium foil is used for shielding, it will have to be very carefully packaged to avoid any slight movement of the foil. Other thoughts include the possibility of grounding the foil, which in its ungrounded state could yield some unexpected effects. This requires more investigation.
We intend to investigate an alternative circuit for using the HB100 sensor. The Gravity Microwave Sensor is hardwired as a motion detector for human and other physical objects, not water velocity. We'll need a more versatile platform to experiment with in order to develop a sensor for measuring water velocity. For this reason, we will be building a custom circuit.
10th February 2020
Rather than using the motion detector, which has a digital output with non-customizable componentry, a custom amplification and band pass filter was built to communicate with the HB100 sensor directly. In particular, the motion detector is calibrated to detect human motion, and has hardwired components which cannot be modified easily. This is not directly applicable to our application, so we decided to make some changes. We used a new circuit from the documentation for the HB100 sensor. Testing with this new circuit gave more consistent measurements for tracking voltages. There were previously some issues with the motion detector, particularly with the sensitivity toggle giving unpredictable results and picking up noise. Noise seems to have reduced with this new set-up.
11th February 2020
Today, further testing was done with the new amplification circuit. Various methods of extrapolating the velocity signal from the sensor were tried.
The sensor was used to detect flowing water in a PVC pipe (an identical setup to before). The pipe could be angled more steeply to increase the velocity of water flowing through it. With the new sensor, motion could be detected when the sensor was more than 25cm away from the pipe. Readings could be made at around 1m away from the pipe, which is a significant improvement in terms of sensitivity.
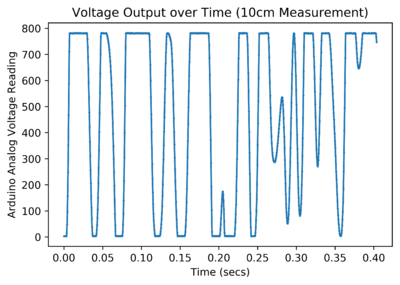
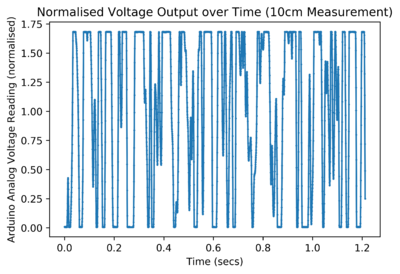
After taking the raw data using the sensor, it was post-processed to try and determine the velocity of the water. Several methods were used to do this. The output of the circuit takes the form of an analog signal which oscillates around 2.5V, and clips at around 4V when a large amount of motion is detected.
Initially, a peak-counting method was used for the data. This yielded a consistently good result for close measurements; a steeper pipe always had a higher extrapolated velocity reading. For this method, whenever the signal went above 3.9V, it was counted as a peak. The frequency of the signal was extrapolated from that which allowed velocity to be calculated.
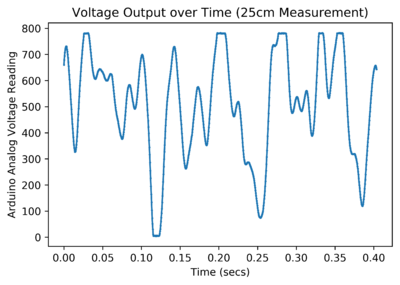
For data where the sensor was further away from the pipe (even at around 25cm), the sensor couldn’t pick up as much of a signal and the clipping no longer consistently occurred. This meant that the above method would register a lower velocity as distance increased.
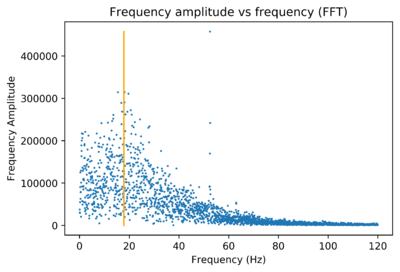
A FFT was used to find the most dominant frequency of the data and that was used to find the velocity. Two different methods were used to find the dominant frequency.
For one method, the maximum frequency point was used and simply assumed to be the dominant frequency. For the other method, the amplitudes of adjacent frequencies were summed together in bins, and the largest bin was chosen as having the dominant frequency. These gave different measurements for the behaviour of the FFTs. Below, the orange line indicates the ‘bins’ method for finding the dominant frequency.
The maximum frequency point, in this case, is a 50Hz outlier which we assume corresponds to noise from mains wiring. This noise has quite a substantial profile particularly when signal strength decreases with higher pipe-sensor distances. Mains noise may be a problem if an FFT is not used to find velocity. This may require more investigation. The maximum frequency point method can nonetheless be used when the amplitude of the signal is strong with smaller pipe-sensor distances.
These methods involving the FFT worked more consistently for larger distance measurements, but there was still too much variation in the FFTs which yielded unpredictable results. It appears as though the hardware needs improvement instead.
12th February 2020
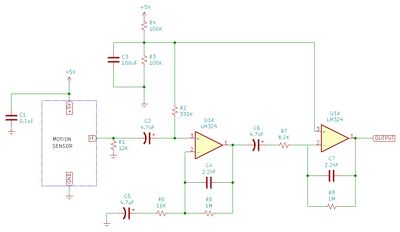
The IF terminal of the HB100 sensor outputs the doppler signal with very small amplitude. It has a constant -70mV signal which fluctuates by around 50mV when motion is detected by the sensor. The new amplification circuit uses two band-pass filters set-up in series.
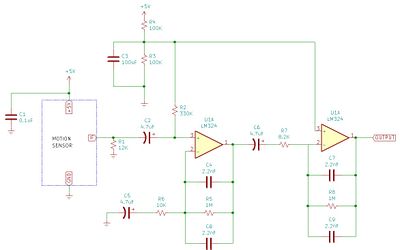
Extra componentry helps regulate the amplified voltage of the IF terminal to a DC signal of 2.5V and helps reduced noise generated in the circuit. The band-pass filters are set to have edge doppler frequencies 3Hz and 72Hz, which corresponds to velocities between 0.05m/s to 1.0m/s. Despite this, the filters have a very shallow decay slope so velocities which are outside this range can still be measured. Thus, these filters were slightly modified to use a narrower frequency band which would allow us to remove more noise from the signal. The amplification of the op-amps was also increased to see if this would result in consistent clipping of the signal over a longer measuring distance, which would allow for the initial peak-counting method to be used. This seems to have given better results for the peak-counting method, but unfortunately, the noise signal was not reduced substantially enough by the band-pass filters to allow us to amplify the signal further for larger distances. The amplification from the sensor was reduced back to the documentation circuit. The narrower frequency range from the band-pass filters seems to have made a positive impact on measurement accuracy, so this change will be used for further testing. The circuit we will be using subsequently is shown below. Note that the capacitance in the band-pass filters has increased, such that the doppler frequency range is between 3Hz and 36Hz, which corresponds to velocities between 0.05m/s to 0.52m/s.
13th February 2020
A new method was devised for post-processing the raw data. The signal from the circuit was normalised and all peaks that are higher than a threshold normalised voltage were counted as using the peak-counting method to find velocity. For the closest measurements, 1.4 was used as the threshold normalised voltage, which gave velocities that increased with increasing pipe steepness. For other distances from the pipe, a good qualitative comparison between pipe angles was also observed using a lower threshold normalised voltage. The threshold voltage had to be reduced, as with longer distances from the pipe, the spread of normalised voltage readings actually decreases as well. With appropriate calibration, this means we can measure velocity differences for constant pipe-sensor geometries. Further experimentation can be made with calibrating for different distances/angles between the pipe and sensor.
Distance, angle, mass flow rate and water velocity all contribute to the sensor giving variable readings. Noise is also quite substantial from power outlets, even when no human movement is detected, which can throw off readings and give misleading results. Further experimentation will have to heavily regulate all controlled variables to isolate the water velocity reading.
The noise signal from the sensor circuit in an empty room with no movement was more carefully analysed. An FFT shows that there is a substantial 50Hz noise frequency.
The narrowing of the band-pass filters reduced the noise amplitude, as was seen in the FFT. Meanwhile, this left no noticeable changes to the signal strength. The new method was adapted to count all peaks with a threshold voltage reading of 1. This would mean that the standard deviation of the signal strength (which changes with water-sensor distance) could be ignored. Taking these results gives velocity readings which don’t fluctuate much with water-sensor distance, but seem to lack precision due to the 50Hz noise. If 50Hz signals could be isolated, then this method could have promising results. Unfortunately, however, this would mean that water flowing with a doppler shift of 50Hz (which corresponds to 0.7m/s) wouldn’t be possible to measure. This will be explored further.
A better set-up with a small flume will allow us to explore the behaviour of the sensor when the water velocity-sensor angle changes. Beforehand, sensor angle was merely a controlled variable, but now it can be properly explored.
17th February 2020
More theory was done on the sensor. Previously, the angle of the sensor relative to the water flow was kept constant to avoid dealing with the additional variability due to changes in angle. The relative magnitude of water velocity measurements should be preserved by this assumption.
Today we delved a little into the angular variability:
This theory indicates that the end of the Fourier Transform peak rather than the top of the peak is more significant as a gauge of flow velocity.
More testing was done in the small flume. The water flowing in the flume was adjusted to have a constant height along the direction of flow. Given that the water volume flow rate through the pipe is constant, the height of the flowing water should be inversely proportional to the velocity of the water.
Due to the small amount of water in the flume, inserting the (rather bulky) FloMate probe into the water disturbed the flow. Only one velocity measurement was needed to determine the water velocity for all water heights. A large velocity was used to take this measurement, as with lower velocities the probe disturbed the flow more. The velocity of water was approximately 1.1m/s when the height of water in the flume was 16.5mm. This measurement is probably quite unprecise, but any mistake in this value simply means the calibration factor will be wrong, and won't affect the relative magnitude of velocity measurements for different water heights.
The sensor was placed on top of the flume and rotated such that the more or less stable-signal-strength-angles -60 to 60 degree in the azimuthal direction pointed at the water. This gives the closest possible link between to the theory, which assumes that the signal is stable across all angular directions.
Source: https://www.limpkin.fr/public/HB100/HB100_Microwave_Sensor_Application_Note.pdf
The height of the flowing water was varied and the sensor data was taken whilst ensuring that the sensor did not move.
The end of the peak for all the heights was approximated by eye. This gave a good qualitative correlation between doppler frequency at the end of the peak and velocity. However, the approximated end-of-peaks doppler frequencies undoubtedly had a large degree of error in them.
Subsequently, measurements were taken for the same water velocity but with varying sensor positions. It was found that the angle of the sensor significantly affected the position and distribution of the peaks. For example, the following graph depicts two sets of measurements in between which the only change was that the sensor was rotated by 90 degrees in a vertical axis (in both cases, the sensor was lying flat on top of the flume)
Here is the same graph but with the data for orientation 1 shifted up (for improved visibility)
This shows that due to the different sensitivities for different angles, the sensor most likely produces a peak based on the direction it is facing. I.e. If the rather pointy sensitivity maximum from -20 to 20 degrees in the elevation direction are pointed at a particular section of water, then the Doppler shift frequency of that water will be very strongly exaggerated in the FFT.
Using a peak-counting method to determine the velocity of these two orientations also gave vastly different results.
18th February 2020
Yesterday’s data was processed using a peak-counting method as well. This gave a reasonable correlation.
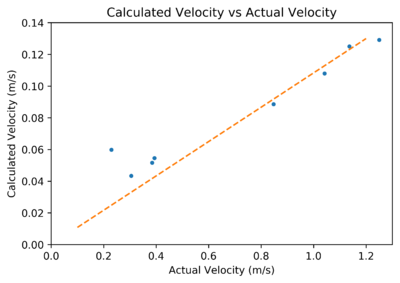
The orange line has slope around 0.14, such that actual velocity is around 7 times higher than the predicted value using peak-counting. No post-processing computational flaws were found, so it is suspected that the sensor itself is giving unexpected results. Part of this factor may be due to a larger angle ‘theta’ from yesterday’s theory, but it is doubted that this would scale velocity down by a factor of 7. A calibration curve may enable us to ignore this peculiarity; it is hoped that this problem arises since we are detecting water rather than physical objects and not due to the geometry of the small flume. If this is caused by the small flume’s geometry, then the sensor may be intrinsically inadequate for the required application, so further testing with different flume geometries to investigate this will be required.
This graph is likely a useful alternative to the end-of-peak method used for the prior graph, as it is computationally much easier. There is a strong correlation in the behaviour of either method for finding velocity, which hopefully indicates that both methods are viable. In either case, the lowest calculated-velocity point has an unusually high measured velocity. This is undoubtedly due to the positioning of the sensor in relation to the flume: The sensor was positioned on top of the flume, so higher water heights (which corresponded to lower water velocities) had flowing water much closer to the sensor. Referring to the theory from yesterday, this means that the angle ‘theta’ is on average smaller for the measurements, which yields a higher calculated velocity. Positioning the sensor below the flume is not an option due to the metal framing of the flume. For subsequent measurements, the sensor will be positioned above the flume at a variable height such that the sensor-water distance is constant. Additionally, a 3D printed case will be used to point the sensor at the water at the right angle. Satisfyingly, the 3 highest velocity points have a good linear relationship between actual velocity and measured velocity. Seeing as how they have similar actual velocity and therefore similar height of water, it makes sense that the angle ‘theta’ is similar so there is little uncertainty. Nonetheless, the 4th highest velocity point, which is grouped close to the 3 highest velocity points, unexpectedly has a much lower measured velocity than it should. The reason for this could be the nature of the water flow in the flume: For small heights of water, the water could be regulated to flow at a constant height, but for slightly higher water heights, the water could start forming waves and becoming turbulent. This may have been a problem that went unnoticed for this measurement. Ultimately, the small flume is not an entirely ideal testing environment and full-PVC-pipe conditions are needed to adequately use the sensor.
The circuit which was used from the documentation has peak frequency corresponding to the velocity of human motion. Measuring water velocity with varied sensor angles throws off any calibration factors between peak frequency and velocity. As such, it is reasonable to reduce the amplification of the op amp so that the voltage never limits to the maximum and then to count all peaks which are above some custom-chosen threshold value. Since we are counting peaks, the resolution of the readings aren’t really important anyways. The new circuit shown below reduces the amplification power of the second op amp, which will allow us to see a greater range of voltage values and to be able to better process the output data through a FFT or for peak-counting. This circuit will be used in the subsequent set of velocity measurements in the small flume.
19th February 2020
Further tests were done with the revised set-up; the circuit was changed, a 3D printed case was used, and the height of the sensor above the flume was varied so that the distance between the sensor and water surface remained roughly constant within +-5mm. Overall, this seems to have given better results when using a peak-counting method.
Varying the height of the sensor seemed to have the expected effect, although the rather short length of the flume may mean that varying height can expose the sensor to detect more turbulent water motion at the front and end of the flume. This means that changing sensor height is not affecting just one variable.
With today’s tests, it was observed that the lowest measured water velocity had an unexpectedly high calculated water velocity – just as in the previous tests. This is most likely due to the nature of the flume; with increasing water height, more turbulent water motion at either end of the flume may create high-moving air bubbles which the sensor will detect. This effect seemed more prominent at the start of the flume: By positioning the sensor in three different points along the length of the flume for constant water motion, from beginning, middle to end, water velocities of 0.064m/s, 0.049m/s and 0.055m/s were detected, respectively. This supports the theory. Visibly, there were more air bubbles at the beginning of the flume as well. This raises the concern that the sensitivity of the sensor may be affected by how many air bubbles are trapped in the flowing water, or also by factors such as the turbidity of the water.
21st February 2020
Development of the microwave sensor has been put on hold while an appropriate testing environment is built to enable more reliable data collection. The small flume demonstrated the viability of the sensor for determining a calibration curve to measure high water velocities, but for lower water velocities, the physical design of the small flume prevents appropriate testing. With the new testing environment, any other drawbacks or features of the microwave sensor will also become more apparent. Velocity measurements around 0.7m/s haven’t been measured, which is exactly the velocity that corresponds to a 50Hz doppler shift. These measurements may be interfered by the 50Hz noise from mains wiring. Removing this noise, in particular, would really decrease noise picked up by the sensor (an FFT shows that the 50Hz noise is a very dominant signal picked up by the sensor in an empty room). A method for removing the noise would be finding the FFT of signal, removing frequencies at 50Hz, then taking an inverse FFT and counting peaks. The mains wiring noise takes up a quite narrow frequency domain in an FFT and removing signals from 51-53Hz (or rather, setting all frequencies from 51-53Hz to be the average of surrounding frequencies) would remove essentially all mains wiring noise while seemingly leaving all frequencies which correspond to the sensor output unaffected (as these signals have a much wider range of frequencies). The inverse FFT does indeed appear to have less noise and have less sporadic peaks. Once the new testing environment is built, and 0.7m/s flows can be measured, this method can be further explored. At the moment, the geometry of the sensor/flume likely plays a much larger role in causing error. Additionally, this method may be quite computational if frequent velocity measurements are required.
25th February 2020
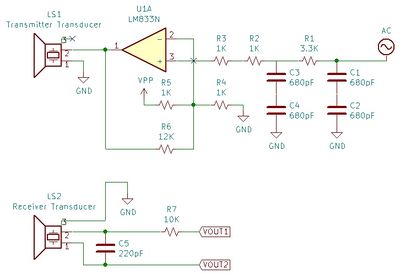
Ultrasonic sensors have been utilised to transmit and receive a 1MHz signal. A (quite noisy) 1MHz signal is generated by the Arduino, before being smoothed out by a series of low pass filters. This signal is fed into an op-amp to amplify it and to create a more stable driving voltage for the transmitting transducer.
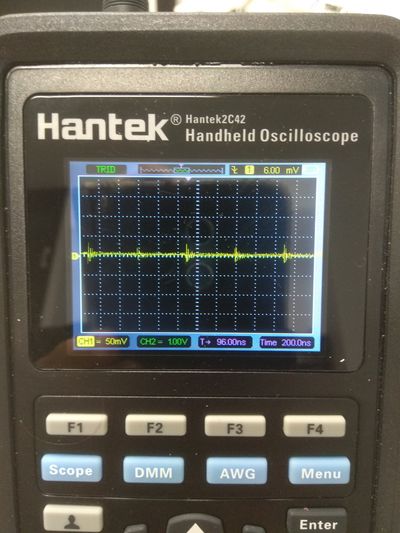
The receiving transducer detects a noisy signal. 1MHz spikes occur at regular intervals which most likely correspond to the sporadic 1MHz signal that the Arduino outputs (this can be removed by using a 1MHz crystal in place of the Arduino).
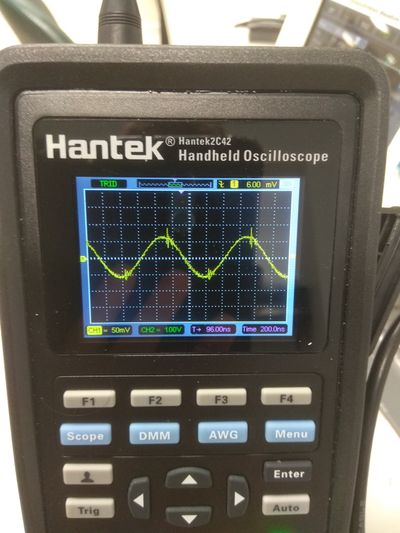
This is passed through a low pass filter to isolate the 1MHz signal received from the transmitting transducer. Pictured below is the output of the receiving transducer when the transmitting and receiving transducers are pressed against one another. The signal is very clear, but quite small (in the order of 120mVpp).
However, any received ultrasound signal that has travelled through a pipe (rather than in direct contact) will likely be of a very small amplitude with a low signal to noise ratio. Conventional out of water ultrasonic flow velocity sensors transmit and detect a customised (variable amplitude) 1MHz ultrasonic pulse, which would allow very precise TOF measurements. This, however, would require very high signal to noise ratios which may be difficult to achieve using low power (which causes lower transducer amplitude), low sampling rate Arduinos (which cannot sample at 1MHz). While certain high-frequency chips could make this possible, it is unclear if this is realistically feasible.
For this reason, it is hoped that instead, the amplitude of the 1MHz signal can be observed and that when this reaches a threshold value, then the TOF of the ultrasonic wave can be measured. The Arduino lacks the precision to calculate TOF to the required precision, so a TOF chip, such as the TDC7200 (which has 55ps precision) will be used to detect accurately the TOF.
An envelope demodulator circuit (or simply a diode) paired with an op-amp should give very good amplitude readings to the Arduino when the transducers are in contact (which will be fed into the TDC7200). With actual measurement conditions, low pass filters can only be used to block out noise above 1MHz, which may prevent good measurements. For this reason, a mixer may be used in the form of a narrow band-pass filter for signals close to 1MHz: After passing the signal through the mixer and through a low pass filter, the doppler shift frequency is found. Amplifying this with an op amp and calculating its amplitude will allow us to trigger the TDC7200 once the doppler amplitude passes a threshold voltage. This method may simultaneously give an alternative avenue of measuring velocity through the doppler shift as well.
27th February 2020
The transmission of the ultrasound through a PVC pipe were investigated. A PVC pipe was filled with water, and the transmitting and receiving transducers were clamped tightly onto either side of the pipe, directly opposite one another. No observable signal could be detected. Clamping two transducers to either side of one side of the PVC pipe gave a very small reading, around 10-20mVpp. When positioned in a sink filled with water, the transducers produced a very strong signal when pointed at each other. Reflection from the metal sides of the sink was also very prominent, which suggests that a very small fraction of the signal is transmitted through the water-metal boundary with virtually all the ultrasound being reflected. Clearly, the transmission of the ultrasound through the pipe needs to be increased.
The amount of transmission occurring through two mediums depends on the acoustic impedance of either material. The proportion of sound intensity being transmitted is equal to 4*z_2*z_1/(z_1+z_2)^2. PVC and water have similar acoustic impedances; 3.27 MPa*s/m^3 and 1.483 MPa*s/m^3, which gives a transmission coefficient of 0.86. This suggests that for transmission through the PVC pipe should yield an overall transmission of 0.86^2 ~ 0.74 for the two water-PVC transmission boundaries. Ignoring the attenuation of the signal due to transmission through the water/PVC, the only other signal loses should be due to the transmission boundary between transducer and PVC. Even small amounts of air can completely disrupt the transmission (as air has a much lower acoustic impedance). Medical ultrasound uses an impedance-matching fluid between the transducer and the patient; similarly we will need to find a material that has acoustic impedance between that of the PVC (or metal pipe material) and the transducer that will help increase the amount of signal transmission. This material will be tightly clamped between the transducer and pipe and will have a circular shape that matches the pipe’s curvature to maximise surface contact area. Ideally, this material will have non-uniform acoustic impedance that changes from 2.9 (which is probably close to the acoustic impedance of the transducer) to 1.483 (the acoustic impedance of the PVC). If a supplier of something like this can be found, this would maximize the transmission. Alternatively, a material which has an acoustic impedance somewhere between 2.9 and 1.483 (a bit of maths shows that 2.07 is optimal and gives a transmission coefficient of 94.5%) can be placed in between the two surfaces, which would also improve transmission.
2nd March 2020
Testing was done with measuring the velocity of water in the large flume with the Microwave Doppler Shift sensor. In the first series of measurements, the sensor was placed, stationary above the large flume, and was sloped at a 45 degree angle using the 3D printed case (theoretically, this maximises the spread of the sensor’s detection angle at the water). The velocity of the water in the flume was varied between 0.1-0.4 m/s by lifting and lowering the flume’s exit channel. This varied the height of water in the flume and therefore varied the velocity of water. For each water velocity, measurements were taken with the microwave sensor after the water reached a stable height/velocity. Velocity was recorded using the velocity probe, although it should also be possible find velocity using the height of water in the flume (perhaps the water velocity is not uniform and the velocity probe gives incorrect velocity readings and this could double-check that everything is in order). The microwave sensor was used to find velocity using both a peak-counting method (using interrupts in the Arduino), and through post-processing the raw sensor data in Python. Separate trials were used for each set of measurements as interrupts would very likely disrupt measurements of the raw sensor data. The readings that were found give no correlation between microwave sensor readings and the flowmeter velocity.
Analysing the raw sensor data reveals that as the velocity of the water increased, the amplitude of the sensor data appears to decrease. This is most likely due to the water height dropping such that the water is further away from the sensor. This, of course, decreases the frequency with which the signal reaches the threshold voltage value such that a peak is counted using the interrupt method. Post-processing the data in Python and using the peak of FFT’s to gauge velocity doesn’t produce promising results either. As can be inferred from the raw sensor data incurring a noticeable change in amplitude due to a larger height difference between the water and the sensor, the sensor has a quite short range of detection for water. Thus, changing the height of the sensor above the water may also change the angle of the sensor’s detection of the water, which would decrease the frequency of the sensor’s readings, which again, would decrease the velocity extrapolated from the sensor.
The tests were repeated whilst keeping the sensor at a constant height above the water. Boxes and polystyrene sheets (which shouldn’t affect sensor readings) were placed under the sensor to maintain a constant sensor-water height difference within +-0.5cm.
These readings similarly give no correlation for peak-counting. Another factor which could contribute to this error is the smaller amount of water when the water height is low (high water velocity). This would mean that there is a smaller amount of particles in the water that the microwave radiation could reflect off of, therefore decreasing the frequency of the measurements (the amplitude of the signal appears to be more consistent for different water velocities for this set of measurements – which supports the idea that height difference did indeed cause error for the previous set of measurements). For post-processing with Python, there appears to be a trend in the first few data points, but for the last measurement the sensor velocity drops very suddenly. This may be due to the reduced amount of water in the flume; this has given a much more lopsided FFT transform for this particular datapoint, which may be explained by the theory discussed on the 17th of Feb (that the end of the FFT rather than the peak of the FFT corresponds more to velocity). This data will be re-analyzed with using the end of the FFT to find velocity, which will potentially give a better correlation.
6th March 2020
Using the frequency corresponding to the end of FFT peak gives much more promising results for both sets of measurements.
These results also give velocity readings which are quite well scaled relative to the actual velocity (i.e. Using the formula for converting doppler shift to velocity).
The fact that this method gives a good correlation actually suggests that using the peak of an FFT or using a peak-counting method may be infeasible. Consider the following two FFT’s for two different water flow speeds.
The peak of the slow water flow has a higher peak-doppler-shift-frequency (corresponding to higher water velocity) than the fast water flow; which gives inaccurate results. The end of the peak for the slow water flow (taken to be around 13.5Hz), however, is at a much smaller frequency than that of the fast water flow FFT (taken to be around 23Hz). This shows that the width and lopsidedness of an FFT relates to the velocity reading. In particular, since the peak of the FFT also corresponds to the peak-counting frequency, these two methods for finding velocity don’t account for the width of the FFT for finding velocity, which should be vital information for finding velocity.
9th March 2020
To ensure that the end of peak is can be more systematically found, an algorithm was built to determine the doppler shift frequency at the end of the peak. This produces a good correlation between calculated and measured velocity for the large flume measurements.
Largely, this gives similar results to when the end of the peak was found by eye.
As the large flume is currently inaccessible, measurements were using the small flume were used to check the validity of the end-of-peak algorithm. Measurements were taken using a constant sensor-water height difference. This measured data was processed by applying the same end-of-peak algorithm on this data, and a good correlation was found between actual velocity and sensor velocity.
Further testing with the transducers reveals that a clear signal can be observed for transmission through a water-filled plastic beaker, whilst transmission through the same geometry with a PVC pipe filled with water yields no transmitted signal. The acoustic impedance of PVC is 3.27 MPa*s/m^3 while the acoustic impedance of the plastic beaker is likely around 2.40 MPa*s/m^3. This difference in acoustic impedance should not yield such a drastic difference in ultrasound transmission. It is thought that the more flexible plastic beaker can be bent to have more surface contact with the transducer which would allow a much stronger signal to be transmitted through the pipe. Covering the transducers with a few droplets of water also helps transmission through the plastic beaker; the water displaces more air between the transducer and pipe surfaces which reduces the ultrasound attenuation due to any air-solid boundaries. Even though water has an acoustic impedance which is lower than both the transducer and the pipe surface, its function to displace air significantly improves transmission. This suggests that any malleable rubber or silicone, regardless of acoustic impedance, would increase transmission.
10th March 2020
Some more experimentation was done with the microwave sensor. As we are interested in finding the FFT of the microwave sensor data, it is thought that if the raw microwave data is not in the form of a square wave, but instead has a smooth shape, this may result in less noise in the final FFT. In particular, larger frequencies may add up together to increase the length of the FFT, which would reduce the precision of the end of peak method. The raw data comes in the form of a square wave due to the op-amp being limited by the power supply of the Arduino. By reducing the amplification through the op-amp, it would be possible to avoid these peaks from forming, which would allow for less noise to occur. The amplification of the 2nd op-amp was reduced by changing the ratio of resistances whilst keeping the RC value unchanged.
13th March 2020
Due to the large detection angle of the microwave sensor, the end of FFT peak frequency relies on the sensor detecting water velocity through a very shallow angle. To make the sensor work without a shallow detection angle and to also reduce the noise that the sensor detects, a pipe was built to house the sensor to direct the microwaves at a specific angle at the water. This will allow us to measure only one Doppler shift frequency rather than a spectrum, such that the FFT should have a very clear peak frequency which would directly correlate to the water velocity.
In the picture above, the microwave sensor is placed at the very top of the metal pipe. The bottom end of the metal pipe is not blocked off, such that the microwaves are all focussed towards the bottom end of the pipe. Three wires which are connected to the microwave sensor inside the pipe come out of the top of the pipe, and are ready to be interfaced with more circuitry and an Arduino. Some issues were found with the sensor housing; the sensor detects movement through the welds in between the top plate and the pipe body, as well as the hole through which the wires enter the pipe. Additionally, diffraction occurs out the open end of the pipe, such that the microwaves aren’t all focussed on one angle, but will rather detect a small range of angles. Hopefully this diffraction will not be significant enough to cause issues.
19th March 2020
Some of the components required for the ultrasonic out of water flowmeter circuit have very small tabs and are therefore not readily accessible for use with an Arduino. A PCB was built to house this componentry. The oscillating crystals and the mixer were mounted adequately, but due to the very small size of the TDC’s tabs, the mounting of the TDC failed.
The board will be re-printed and the TDC mounted so that it can also be interfaced for the transducer circuit.
The microwave sensor, placed inside the focussing pipe, was used to take velocity data in the large flume. Velocity information was extrapolated from this data by using the frequency of top of the FFT peak, the end of the FFT peak, and a raw-data peak-counting method. The results for two different angles of pipe are shown in the graphs below.
Every data series in the above two graphs shows no correlation between sensor velocity readings and actual velocity readings, apart from the end-of-peak data set in the shallow pipe experiment. As the end of peak method relies on the sensor detecting water flow at a very shallow angle to the water flow, this suggests that the pipe doesn’t focus the microwave beam and that too much diffraction occurs from the mouth of the pipe. This also explains why the other data series show no correlation. The pipe is already quite wide, but the wavelength of the microwaves (around 2.85cm) is too long to avoid diffraction. Instead of using a pipe a different shape could focus microwaves more effectively, but the rather long wavelength of the microwaves means that any focussing device would need to be quite large. Moreover, the microwave beam is required to be very focussed, which might mean that the focussing device would need to be even larger. More investigation will be done to determine the optimal shape for a focussing device and whether it could feasibly work for this particular function.
25th March 2020
A PCB was built for housing the TDC for the ultrasonic out of water velocity sensor circuit. Using a multimeter shows that no short circuits have occurred, which suggests that the mounting was successful.
A bit of theory was done to better understand the features of the FFT of the microwave sensor data. Further analysis is required, but preliminary results seem to suggest that the frequency of the FFT peak may not actually contain information about the velocity of the water. As such, only peak-counting would be useful to find water velocity if the microwave radiation can be appropriately focussed.
27th March 2020
For velocity measurements for the large flume, the peak of the FFT very rarely leaves the range of 2-6Hz. A 4Hz Doppler Shift corresponds to a water flowrate of 0.06m/s, which is lower than the smallest velocity recorded. This can be explained by the fact that the sensor is most sensitive at an angle that points directly down towards the water surface, where the water velocity radially inwards towards the sensor is quite low, therefore yielding a small Doppler Shift. However, the peak frequency should still theoretically increase and decrease relative to the water flow velocity. This doesn’t occur. To investigate possible sources of error for this, a sample ‘signal’ was arbitrarily generated which has a frequency of 4Hz on average. The below graph shows a small section of this signal.
It would be expected that the dominant frequency in the FFT of this signal is 4Hz. 4Hz is indeed a large peak in the FFT, but the absolute dominant frequency is much lower; around 0.38Hz.
This lower frequency occurs simply due to the nature of taking an FFT of stochastic data. The 8Hz frequency peak also stands out; this peak is very likely due to the square wave nature of the sample data, but the possibility that higher frequency peaks can arbitrarily occur should not be neglected.
Using these results, we can infer that lower frequency peaks may unexpectedly occur when taking the FFT of the actual sensor data as well, which would result in a lower peak frequency and water flow velocity being recorded than expected. It is a possibility that the peak doppler shift frequency and this lower frequency are merged together in the actual sensor FFT, so that only one peak is discernible, as these two different closely-spaced peaks mesh together. Rarely, these peaks might not be merged together, such as this FFT of sensor data taken from the large flume:
This theory introduces the idea that there could be no velocity information contained inside the peak frequency in the FFT, which could invalidate this method of finding water velocity. Further investigation may clarify this theory.
