Difference between revisions of "Turbidity Sensor"
| Line 885: | Line 885: | ||
[[File:Circuit diagram.png|600px]] | [[File:Circuit diagram.png|600px]] | ||
| + | |||
| + | ==26th March 2020 == | ||
| + | |||
| + | Today we did several things: | ||
| + | |||
| + | ==== Test the breadboard Arduino==== | ||
| + | |||
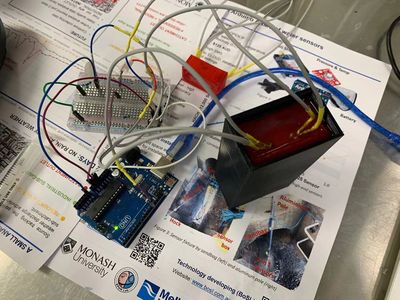
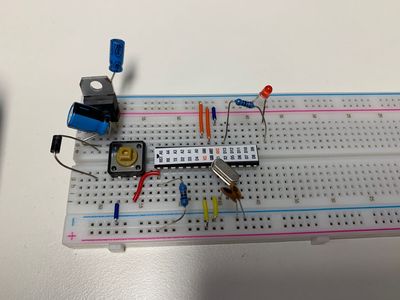
| + | Now we have already set up a breadboard Arduino, base on this test, we are sure that the chip can be used on the PCB to control the turbidity sensor. This time, we did not upload the turbidity sensor code on the board, for testing purpose, we only use a simple blink code to make a LED blink. As it works successfully, we can use a similar thing later for testing. | ||
| + | |||
| + | [[File:Breadboard Arduino.jpg|400px]] | ||
| + | |||
| + | Next step, we will only use this chip to control the turbidity sensor and see if the results will be the same. | ||
| + | |||
| + | ==== Test the BosL board turbidity sensor ==== | ||
| + | |||
| + | We connect the turbidity sensor on our BoSL board, just like the circuit diagram above, we use two digital pins and "HIGH" and "LOW" code to control on and off of the LED and the phototransistor, but we got the problem, as the digital pin of Arduino can output maximum 20mA current, however the current we need for our LED is 100mA, so this connection is not able to support the turbidity. | ||
| + | |||
| + | To ensure we still control on and off of the turbidity sensor, we need to change our design, the power of the LED circuit will be provided by 3.3v directly, but we need to use an NPN transistor to work as a switch, and then use the digital pin to control the whole circuit. | ||
| + | |||
| + | ==== Change the design of the circuit ==== | ||
| + | |||
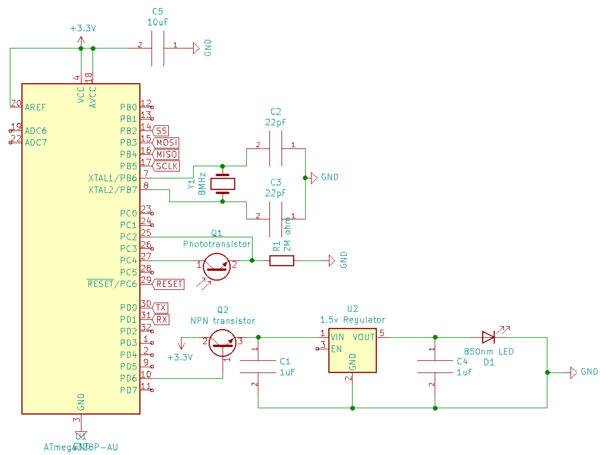
| + | Due to the issue we talked above, we have to change our circuit, not only the LED diagram, but also the crystal, now we change the 16Mhz crystal to 8Mhz crystal. We also add some pins on the board. | ||
| + | |||
| + | [[File:Circuit diagram new.png|600px]] | ||
Revision as of 00:57, 27 March 2020
Contents
- 1 12th November 2019
- 2 13th November 2019
- 3 17th November 2019
- 4 19th November 2019
- 5 20th November 2019
- 6 21th Novermber 2019
- 7 23th Novermber 2019
- 8 27th November 2019
- 9 28th November 2019
- 10 29th November 2019
- 11 2nd December 2019
- 12 3rd December 2019
- 13 4th December 2019
- 14 5th December 2019
- 15 6th December 2019
- 16 10th December 2019
- 17 18th December 2019
- 18 19th December 2019
- 19 20th January 2020
- 20 22 January 2020
- 21 24th January 2020
- 22 4th February 2020
- 23 10 February 2020
- 24 13 February 2020
- 25 14 February 2020
- 26 16 February 2020
- 27 17 February 2020
- 28 19 February 2020
- 29 20 February 2020
- 30 24 February 2020
- 31 27 February 2020
- 32 2nd March 2020
- 33 3rd March 2020
- 34 4th March 2020
- 35 12th March 2020
- 36 14th March 2020
- 37 16th March 2020
- 38 17th March 2020
- 39 18th March 2020
- 40 19th March 2020
- 41 24th March 2020
- 42 26th March 2020
12th November 2019
So we finally made some nice progress with the Turbidity Sensor design.
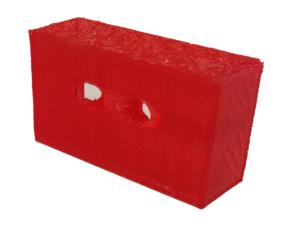
The first step was to print our case using our 3D printer. Here it is:
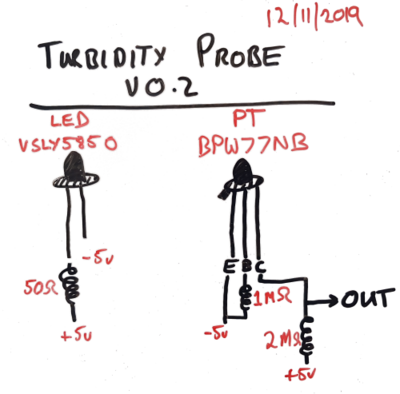
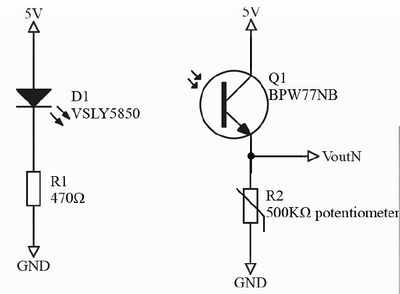
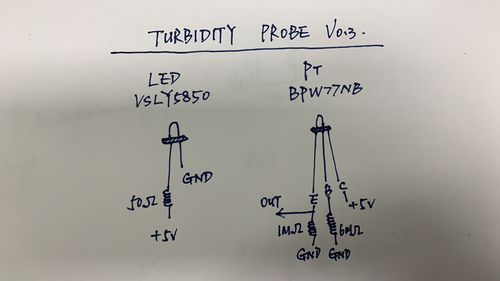
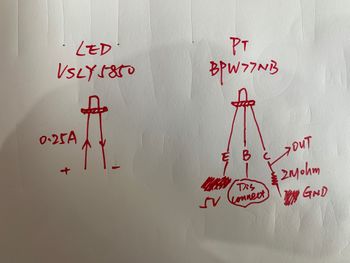
Next step was to test out some hardware for the little guy. We bought two main things: (1) a LED that puts out 850nm wavelength and (2) a phototransistor. The details of the connection we used is here:
We also needed some resistors in the circuit, a 5v power supply and something to read the output (obviously, we used an Arduino)
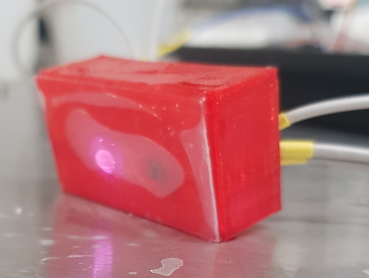
Next step, put it all together and see if it works! So, we used some epoxy and wired this all up to make this sensor:
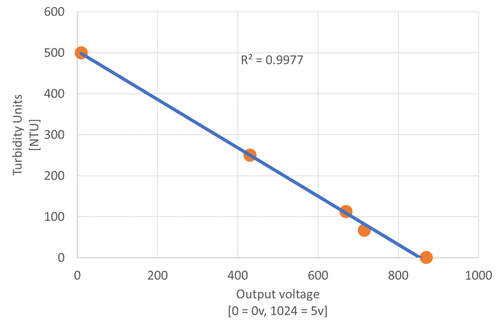
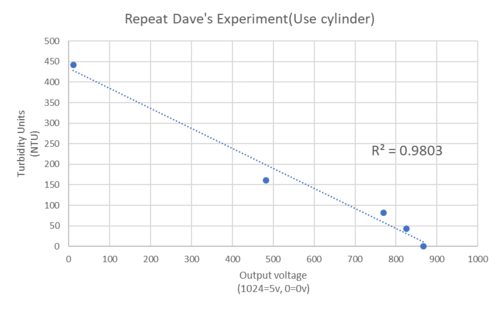
Next step, test the little bugger. We did this using turbidity solutions and a deep cylinder (at least 100mm deep). We tested five turbidity solutions ranging from 500 NTU to 1NTU (tap water). Here are the results we got:
So, in conclusion, we are rather happy with the workings of this cheap turbidity sensor. It costs less than $5 AUD in components, and a little time to put together. The only issue is that the range of the sensor is really limited to just 0 to 500NTU; anything higher and we think we will need to include a photo-diode alongside the phototransistor to get those big NTU values. Also, we are concerned with the energy use that this little puppy dog may take up - the resistors are even heating up (NOT A GOOD SIGN!). The last thing we want to fix is to make this all run on 3.3v instead of 5v...our BoSL board is a 3.3 volt machine, so we want to keep that consistent. Finally (I know, I said the last thing was the final, but this will be) we need to continue to develop our turbidity wiping mechanism...turbidity probes need to be cleaned a lot, so a good wiper is essential or readings are lets just say poor...
Over and out for today.
13th November 2019
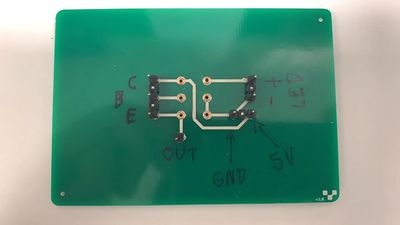
So, today we began making our circuitry for the new turbidity sensor. It is looking good, but when we tried to print the board on our new PCB printer, the ink was all dried up! Come on Voltera, please send us the new ink so we can start printing our boards again! Here is an image of the circuit we made today in an easy to use a program called EasyEDA.
17th November 2019
We have begun designing our wiping device, but to do so we needed to revamp our circuit to allow for some motors to drive the wiping action. We began printing many different versions of the above-board on our Voltera printer (thanks Voltera for finally giving us our consumables), but there were a hole bunch of issues...including that the holes and pads were not optimised for our Voltera. So, we spent the day designing a new circuit that now looks like...
More to come from Miao in the next few days...
19th November 2019
This is Miao's turn for updating the process.
Based on Dave's experience, we started to do the calibration of the sensor.
Now we don't want to use a deep cylinder for testing, as the glass cylinder is transparent, we designed a black box and printed it by our 3D printer. The box is designed to fit our sensor and it is 100% infill. Before we use the 100% infill black box, we have also done a waterproof test of the box. We fill some water in the box, and put the box on a piece of tissue, after 4 hours, we found that there is no water on the tissue. So it can be proved that the box should be waterproof.
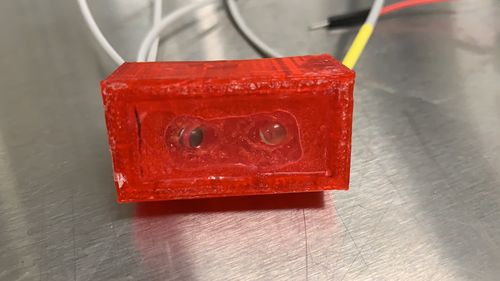
Also, Dave printed another sensor case, which is smaller than the previous one and it has bulgy edges, so it is easier to glue epoxy on the surface of the LED and PT.
So now we have two sensors, the big one which Dave used for testing and a small one with bulgy edges.
After we wired the LED and PT for the small sensor, we tested that, it works and the analogue reading is more than 400 in air. However, when we cover the epoxy piece on the surface, the reading number became 0 or a quite small number(less than 10). Now we use liquid epoxy to glue the epoxy piece on the sensor box, and we need to wait until the epoxy drys and then we will test it in water to see if it has any difference.
To be continued……
20th November 2019
The liquid epoxy is dry and we put the sensor in DI water in the black box, the reading number changed to around 920, and when we get it out in the air, the number changed to 12.
Anyway, as it can be used for testing in water, we started dosing the solution for testing.
We use DI water(0.18NTU) and another lab solution(807NTU) to dose the solution, we change the testing solution's turbidity by adding more 807NTU solution into DI water and then record the analogue reading.
Solution with different turbidity was tested, the range of the turbidity is between 0.18NTU and 807NTU. The step of the testing solution is different in different turbidity range. From 0.18 to 50 NTU, the step is 5NTU, and the step changes to 10NTU for the solution between 50-100NTU, from 100-200NTU, the step is 20 NTU, and from 200-1000NTU solution, the step is 100. Both the big sensor and small sensor are tested.
The results can be seen in the following diagram.
From the data, it can be seen the results is different from Dave's result. From 0.17 to 50NTU, the analogue readings are floating and do not have too much change, and from 60 to 300NTU, the outputs decrease in a narrow range, after that the reading number suddenly changed to a very small number. We also found that for both sensors, the output almost fits a straight line between 60 to 200NTU.
The difference between my results and Dave's may be caused by changing the solution container. We need to do more test and found the problems.
To be continued……
21th Novermber 2019
As the results of the small sensor and the large sensor are different, we tested the two sensors to compare them.
We put both sensors in air, the analogue reading of both sensors is about 12. However, when we put the small sensor in a black box(just in the air without touching the water), the reading is also around 12, and after touching water, the number changed to around 926. For the big sensor, when put it in the black box without touching water, the reading is around 800, and if it touches water, it becomes 926.
I think the large sensor's results are more make sense, as the results in air and in DI water do not have a large difference.
But, why the two sensors perform so different when staying in the black box without water? Another question is why readings become different after touching water?
For the first question, we guess the reason may be the distance between the epoxy and the LED and PT, or maybe the bulgy edges? Now we know that base on our setting, LED and PT are very sensitive about the distance between the epoxy cover and their surface. More work needs to do to figure out these problems.
To be continued……
23th Novermber 2019
Today we did two things:
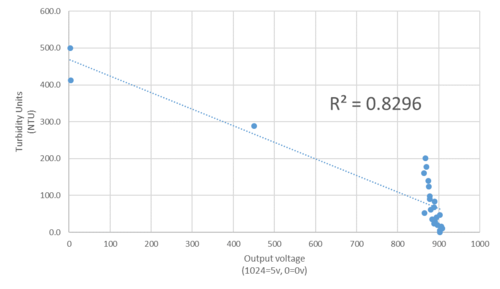
1. We repeated Dave's experiment(use the big sensor to do the experiment in a cylinder), 2. Recalibration(use the big sensor for testing, more accurate as we use a real turbidity sensor to test the turbidity of each solution)
For the first experiment, we got a similar trend but a different result.
I think the reason we got a different result is that we cannot make all the configuration of the environment exactly as same as before, and the sensor is very sensitive to the configuration(the distance between the epoxy and PT) and the surrounding environment, as the epoxy we glued to the sensor case has changed, so it has a different result.
For the second experiment, we use the big sensor for recalibration, and all the solution are tested to double-check their turbidity before testing.
The results are different from previous experiments.
The output results are between 860 to 900 for the solution between 0 to 200NTU, and the analogue output keeps floating, it does not have a specific trend. Therefore, it is not easy to calibrate the result with an equation.
Another problem is when we get the analogue reading for each solution, the reading numbers always have a floating vibration, I think it is a problem of the circuit.
Now the setting of our sensor reports different results in the same configuration, so it is difficult to duplicate the past experiment. We are thinking to change the setting of our sensor(change the resistor or change the sensor case or add some parts)…………
Need to search for more information to develop our sensor……
27th November 2019
As we still cannot get satisfactory results, we want to start to repeat the experiment on the paper and see if we can get the similar results, then we will find the difference between their settings and our design, then figure out the problem.
We did not get the exact same Acrylic tube, so we use the Vinyl tube with inner diameter 19mm to instead, and then we use our 3D printer to print a house of the sensor. The house can hold the tube in the centre and set LED on the top of the house and the PT on the side, so the LED and the PT are perpendicular to each other.
After that, we use the Clear Liquid Epoxy to glue the tube, LED and the phototransistor in the sensor house, the Liquid Epoxy is fully waterproofed and 100% transparent. Now waiting for it dry and test it tomorrow……
28th November 2019
We do use the new sensor box for testing, the circuit is showed as following:
However, the resistor we use has changed, R1 is changed to 500ohm and R2 is 330k ohm. But by using these resistors, the results do not change too much as the solution changes. We have to change the circuit configuration.
The first thing we want to change is connecting the base to the ground. We think the base may perform as an amplifier, and it may affect the analogue reading of our sensor. To compare with the previous test, we increase the resistance of the base, so the resistor is changed to 6M ohm. Another thing is that we want to make the LED brighter, so we change the resistor connecting to the LED as 50ohm. Therefore, the circuit is like:
We put the new black sensor in the glass cylinder for testing, for accuracy, we test the turbidity of each solution before the test.
Then we got the result, it looks pretty much better than before, the result is the linear relationship between the output reading and the turbidity.
Now we sure that the resistor on the base has the critical effects, and we changed the resistor even larger(10M ohm), but the result is not as good as 6M ohm, as the reading in 1000NTU solution is about 1000, that's good, but the reading in air and in DI water is not 0, that's not what we want, so we need to try to find an optimal resistor later.
As we think we have found the critical factor, we just use the 6M ohm resistor on the base and then use the circuit to test the previous sensor(the red one with a piece of epoxy on the surface), we still put the red sensor in the black box, just as the same configuration as before, although the result is better than before, some results are still unreasonable, for example, in DI water, the analogue reading is 177 which is not 0. That means we still got some problem with our design, now we are thinking about how to change our sensor case and design. Also, the floating vibration problem still exists, we are planning to use our PCB printer to get a better board to get rid of this problem.
To be continued……
29th November 2019
As we still want to use the wiper, so the black sensor case we used yesterday should be changed. We are wondering if half of the case can still work. Therefore, we use our 3D printer to print half of our case which is a triangular case. We also use the Liquid Epoxy to glue tube on the case, both the whole tube and half tube are used for testing. The settings are shown as the picture below. Also, our new board is printed out by our PCB printer, just waiting for the sensor ready and then test them.
Just waiting for the Epoxy dry.
2nd December 2019
Now we have two new sensors, one is a triangular case with half tube and another one is a triangular case with a whole tube, now we are going to use these two sensors for testing.
Firstly, we still use the same circuit for testing, and when we found the analogue reading is small, we changed the resistor which connected to the base. From the past experience, we found the analogue reading is getting larger as the resistor connected to the base increases, so we used 20M ohm instead of 6M ohm on the base.
The results can be seen as the following:
For the case with the half tube:
From the result, it can be seen that the sensor with 6M ohm connecting base performs perfectly, and the results show a linear relationship between the output voltage and the turbidity. However, for the 20ohm sensor, it does not perform as good as the first one, so we won't use such a big resistor for our design.
For the case with the whole tube:
The sensor with a whole tube shows a similar result, as the 6M resistor is better than the 20M ohm resistor.
Another thing is that we have test the 3.3v input, and we found the sensor does work with 3.3v input voltage, however, we need to do change our design to optimize the circuit performance.
Although the sensor with half tube works not bad, we still want to use the flat surface, more tests need to be done to find a better way for a flat surface.
3rd December 2019
Now we need to think more and retest the previous experiment which using the flat sensor box.
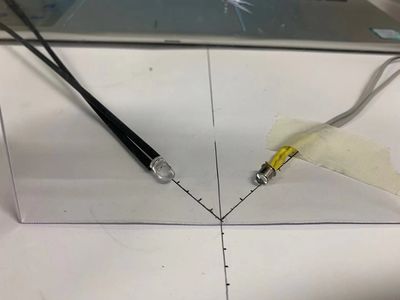
Today we tested the performance of LED and the phototransistor with the different distance between the transparent epoxy and the parts. We use tape to make the LED and the phototransistor in a fix location, and then change the position of the transparent epoxy board.
From the photo above, each unit is 5mm, when we made the LED and phototransistor face to face, the analogue reading is around 760 which is the largest number. Then we start to fix them in a specific location, then change the epoxy's location. Firstly, we make the transparent epoxy board touch the LED and the PT, the analogue is 0, and then we slowly make the epoxy far away from the two parts, in a certain distance the reading number became larger, and kept increasing until the intersection point, at that point, the reading number is 760 which is the largest number. After that, as the distance kept increasing, the number became decreasing and then became 0. Those results mean that: 1. If the epoxy is as close as touching LED and the PT, the sensor does work; 2. If the solution is within a certain distance away from the surface of LED and the PT, the turbidity of the solution can be detected by the sensor 3. In a certain distance, the phototransistor cannot detect the reflected light from the LED, which means the sensor actually does not need a specific boundary condition, because the light cannot reach such far away distance.
From the results, we know that for the flat sensor box, we need to make the epoxy touch the LED and the PT, and this configuration makes the analogue reading is 0 in the air which means the setting of our previous design should be all right. Another thing is that we do not need a boundary condition in our design because the sensor can only detect the reflected light at a certain distance.
Now the transparent epoxy board we use is much clear than the epoxy we used before, the next step we need to use this board for further testing.
4th December 2019
Today we are planning to test the sensor with a flat surface, and the epoxy needs to be glued on the surface of the sensor box.
At first, we used 100% infill white box for testing. The distance between the two holes is 20mm(centre to centre).
At the beginning of the test, we just put the LED and the PT in the two holes to test if the analogue reading is 0 in the air. However, we found that the analogue reading is not 0 when the two little bulbs are in the holes, we took them out and found even they are perpendicular to each other, the reading is not 0. When we used the black box to hide the LED, the analogue reading is still not 0. We found that two problems cause this result, one is the light source of LED is not from the edge of the bulb but the inner part, so the light can penetrate the glass bulb and be detected by the PT. Another problem is that the white box is not light-proof, so the light from the LED can be transmitted from the white box and it can be detected by the phototransistor. That can also explain why the analogue reading is not 0 in the air for the previous test(by using the red sensor box).
Then we used the 100% infill black box to test if the light will transmit through, and we found that the light cannot be transmitted through the black box.
Therefore, to solve the problems, we determine to use our 3D printer to print the 100% infill black sensor box, and to get rid of the light transmitting from the internal part of the box, the sensor box is designed to have two tube at the back the two holes, the two tubes will cover the body of the two bulbs so that light can no longer transmit through the sensor box.
After we set up the sensor box, we glue the epoxy cover on the sensor box surface, and then start our test. The tested sensor is shown in the following photo:
In our test, when the sensor is exposed in air, the analogue reading is 0, and in DI water, it is also 0. It is a good result as it matches our hypothesis. However, when we put it in the solution with 200NTU, the analogue reading is about 10, and when we use 1000NTU solution for testing, the reading number is about 76, so the problem is that the reading number is too small for calibration.
We thought that the problem may be the PT is too deep in the box, so it can detect little light from the LED, next step we need to print another sensor box to make the PT more close to the surface.
To be continued……
5th December 2019
The first thing we need to do is make the tube at the back of the hole shorter, so the LED and the PT are closer to the surface and can touch the epoxy.
The sensor box we used yesterday is a black box with 20mm distance between two holes(centre to centre). Now we use a new sensor box with 14.3mm distance between two holes. We use 14.3mm distance because in the past experiment the tube diameter we used is 19mm, so the distance between the LED and the PT is about 14.3mm. So we test this distance to see the performance. The new case can be seen as the following photo:
And we also connect LED and the PT to the Arduino and found the analogue reading is 0 in air, and when we put the transparent epoxy on the surface, the reading number is also 0. That shows the sensor works well. Next step, we are going to print more sensor boxes with different distance between the holes, 12mm, 10mm and 8.5mm, and then test if the distance between LED and the PT will affect the performance, and then we will choose the best one and test in solution.
To be continued……
6th December 2019
Now we have a sensor box family! Sensor boxes with different distance between holes(8.5mm, 10mm, 12mm, 14.3mm). And we will use these boxes for testing.
Distance testing
We try to put the transparent epoxy board in front of the different boxes with different distance, and then see the analogue reading in different distance. The results showed that if the two holes are closed, the distance between the board and the sensor box to reach the maximum reading number is smaller. For example, for the 14.3mm distance box, when the board is 3mm away from the box, the reading number is 380, and the reading number changed to 650 at 4mm distance. However, for 8.5mm distance box, the reading number is 650 when the board is 1mm away from the box.
So, after the test, we found 14.3mm between the holes is too far away and 8.5mm is too close, so we choose 12mm box and 10mm box for testing.
Solution testing
We used 10mm distance box and 12mm distance box to get the analogue reading in the different solution. For the 10mm box, the readings are still 0 for the solution below 80NTU, and for the 1070NTU turbidity solution, the analogue reading is only 128. For the 12mm box, the number is even smaller, for 1070NTU turbidity is 48. That result cannot be used for analysis. We have also changed the base resistor from 6M ohm to 20M ohm, however, when the resistor is larger than 7M ohm, the reading number in air and DI water is no longer 0, that is not what we want.
We compared with the current design and the previous test design(with round tube in the box), the difference between these two designs is the transparent board, one is a flat board and another is a round tube, that means the LED and the PT have a certain angle between the board, but with the tube, they are perpendicular to the tube surface. So we want to have another test which makes the LED and the PT perpendicular to the epoxy board and see if it will get better.
New sensor box testing
We use our 3D printer to print a new sensor box which is shown below, this sensor box can also make the LED and the PT perpendicular to each other, and the epoxy board could also be glued on the surface of the box which makes the board perpendicular to the bulbs. And the distance between the two bulbs is 14.3mm which is as same as the previous testing box(with a round tube in the centre). Our hypothesis is that if this sensor works, that means the epoxy board should be set as perpendicular to the LED and the PT, so we can try to cut two small round epoxy board and set them into the two holes which are perpendicular to the two bulbs.
To be continued……
10th December 2019
Today we used the L shape sensor box for testing. When we started our test, we got a serious floating vibration problem. When the sensor is exposed in air, the analogue reading is not 0, the range is between 8 to 21, and the numbers keep changing.
To solve this problem, we try to change the resistor on the base and on the emitter. For the base, when we changed the resistor from 6M ohm to 4M ohm and then 1M ohm, the analogue reading number became smaller but still not 0, and the floating vibration problem still exists. We have also changed the PCB board to the breadboard, but the situation did not change. The resistor on the emitter has also changed, however the analogue reading did not change too much.
At last, we used a new LED and a new phototransistor which are soldered by new wire, this wire we used is thicker and more rigid than that we used before. After we changed that, the analogue reading in the air is constantly 0. However, when we face the PT to the lamp, in a certain angle, the reading increases.
Now we found that the floating vibration problem may be caused by the wire, and the lamp may emit light which can be detected by the phototransistor, and that problem may affect the results of our experiments.
In the following test, we still need to use a black box for solution container to avoid noise from the lamp or other light sources.
To be continued……
18th December 2019
New update for our turbidity sensor.
Now we need to continue testing the last sensor with L shape sensor box. This time, to avoid the noise from the breadboard, we would not connect the resistors in the breadboard, instead, we will solder the resistor on the pins. Apart from that, to get rid of the noise from the lamp or the laptop screen, the solution will be contained in a black box which is printed by our 3D printer, and the cap of the black box is also printed. That cap will cover the top of the box, only one small hole will sit on the cap to allow the cables to come out, with this configuration, the noise from the other light source will almost be eliminated.
Just wait for the 3D printer completing the printing task, and then we can use the case and the container for testing.
To be continued……
19th December 2019
All the facilities for testing are completed this morning, as usual, we still use the liquid epoxy to glue the plastic board on the sensor case, and then pouring the liquid epoxy at the back of the LED and the phototransistor so that the sensor is fully water-proof. When testing the sensor, the solution container will be covered by the cap. The testing facilities can be seen as the following pictures:
This time, the thick wire and the black container with a cap are used to avoid the noise. As a result, the analogue reading is much stable than before. When we put the sensor in the black box and covered with the cap, the analogue reading is constantly 0, and the reading number is also 0 in DI water, the floating vibration problem is almost disappeared.
By testing different solution, the results are shown in the table:
| Media(NTU) | Analogue reading |
|---|---|
| Air(in black box) | 0 |
| 0.18 | 0 |
| 62 | 0 |
| 82 | 0 |
| 165 | 26 |
| 432 | 198 |
| 600 | 220 |
| 1036 | 352 |
The problem is that the analogue reading number is too small for the solution below 100NTU(almost 0), so it is not suitable for stormwater monitoring.
The reason may be the light source is not strong enough, we need to change some settings to let the light source stronger. For example, the successful sensor insert the tube in the middle of the case and the tube can congregate the light as a concave lens, can we use concave lens on the top of the LED to get the light source together?
We will try to do this kind of thing.
To be continued……
20th January 2020
We got the new update of our turbidity sensor development.
Now we have done several tests: distance test, LED resistor test, and the PT base resistor test.
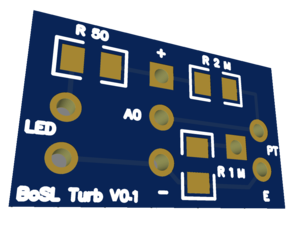
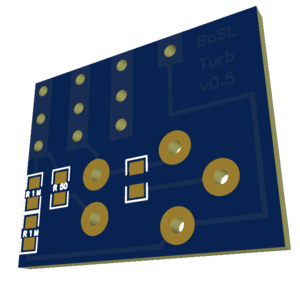
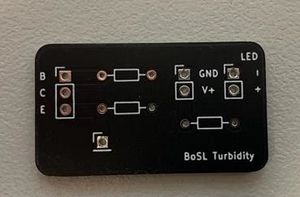
Now we are using our new turbidity sensor board, this board is small and easy to connect all the pins when testing, and the analogue reading output is also more stable than the breadboard, the following picture shows our new board.
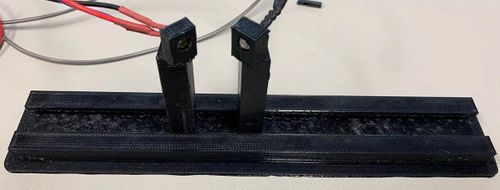
To make sure the LED and the PT sit at the fix position, we used our 3D printer to print a rail and the LED and PT holder, the holder can move on the rail and stand at a fixed position, as the following figure shows.
For all the test we did this time, we just put the LED and the PT in the holders and change some factors(distance, resistors, type of LED) to see what factor affects the results most. By this configuration, the closest distance between the LED and the PT is 6mm, that means at 6mm distance, the edges of the holders touch each other. And for the circuit, the input voltage is 5V. This time we did not glue the epoxy on the holder.
Distance test
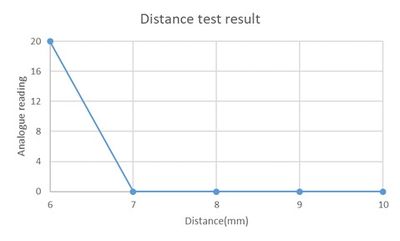
Experiment Description: To test which distance will affect the analogue reading of the LED and the PT. We use the 6 degrees angle LED(brought from digikey), and use 51ohm resistor connecting to the LED, for the phototransistor, connecting 1M ohm resistor on the emitter, and connecting 5M ohm resistor on the base. By changing the distance between the LED and the PT(centre to centre) in the air, and use the cardboard box to cover them(making dark environment and avoiding noise), then record the analogue readings to see what the closest distance can be used between them. The closest distance means when we put them in the air, the analogue reading should be 0. The results for this circuit configuration is in the table below:
| Distance(mm) | 6 | 7 | 8 | 9 | 10 |
| Analogue reading | 20 | 0 | 0 | 0 | 0 |
That means for this configuration, the closest distance should be 7mm(centre to centre).
LED resistor test
Experiment Description: As the last test shows when put the PT and the LED within 6mm distance, it has analogue reading. We just use this distance, and change the resistor on the LED, and then see how the analogue reading changes. We still use the 6 degrees angle LED, and the 1M ohm resistor on the emitter, 5M ohm resistor on the base.
The results are shown in the table below:
| LED resistor(ohm) | 10 | 20 | 50 | 100 | 200 |
| Analogue reading | 200 | 100 | 20 | 0 | 0 |
This result shows that in this configuration, if the resistance of the LED circuit decreases, the analogue readings increase, which also means that the LED is brighter. However, when we use 10 ohm resistor for the LED circuit, the resistor is super hot that even hand cannot touch it.
PT base resistor test
Experiment description: From the LED resistor test, the analogue reading in 10 ohm resistor is 200 which is a large number, so we just use the resistor as 10 ohm which will obviously show the changes of analogue reading when we change the base resistor. In this test, we change the base resistor from 2M ohm to 20M ohm, and the analogue reading also changes, the reuslts are shown in the following table.
| Base resistor(Mohm) | 2 | 5 | 7 | 10 | 20 |
| Analogue reading | 30 | 200 | 300 | 380 | 860 |
This result shows that as the base resistor increases, at the same configuration, the analogue readings increase, and we need to choose a right resistor to make the analogue reading is 0 in air within a certain distance between LED and the PT.
To be continued......
22 January 2020
LED number changing test
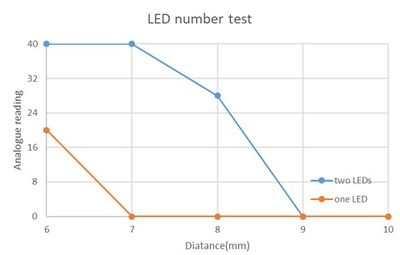
Experiment description: As we try to make the LED brighter, so we are thinking to add the number of LED, now we use two LEDs in the circuit, and the two LEDs are vertically set in a new LED holder. In the circuit, the resistor for the LEDs is 50 ohm, by changing the distance, record the analogue reading and compare with the results of the distance test.
| Distance(mm) | 6 | 7 | 8 | 9 | 10 |
| Analogue reading | 40 | 40 | 28 | 0 | 0 |
From the result, it can be seen that, with two LEDs, the analogue is doubled at 6mm distance and it also has readings at 7mm distance and 8mm distance, which means more LED will make the light source brighter. Next test, we will change the configuration for further test:1. make the LEDs horizontally beside each other 2. change the LED resistor to 10 ohm and see the performance.
Different LED test
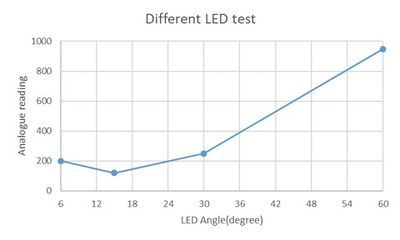
Experiment description: Now we have four types of LEDs: LED with 6 degrees(from Digikey), LED with 15 degrees(from China), LED with 30 degrees(from China), LED with 60 degrees(from China). Now we need to test the impact by using different angles. This time we use 10 ohm resistor LED, 5M ohm resistor on base, 1M ohm resistor on emitter. The distance between the LED and the PT is 6mm. The result is shown below.
| LED Angle(degree) | 6 | 15 | 30 | 60 |
| Analogue reading | 200 | 120 | 250 | 950 |
From the result, we can see that, the LED from Digikey is different from the Chinese LEDs, for the Chinese LEDs, as the angle increases, the analogue reading also increases. To make the analogue reading large enough in the low turbidity solution, I think we need to choose a large angle LED for testing.
Next tests, we will try to test the different angles between the LED and the PT, NOT ONLY FOR 90 DEGREES BETWEEN THEM. And we also need to do tests in water to see how the sensors perform in water.
To be continued……
24th January 2020
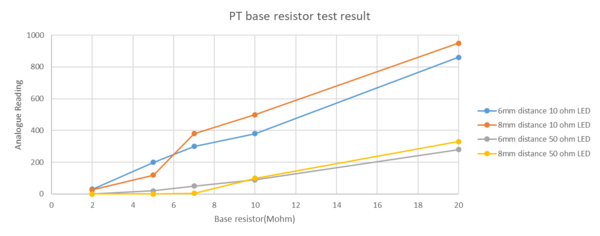
We have repeated the PT base resistor test, this time we not only change the resistors connecting to the base, but also change the distance and the resistor on the LED. This time we make the distance at 6mm and 8mm, and the resistor on the LED are 10ohm and 50oh. And other configuration of the circuit did not change.
The results can be seen as the table below:
| Base Resistor(ohm) | 2M | 5M | 7M | 10M | 20M |
| 6mm distance 10ohm LED | 30 | 200 | 300 | 380 | 860 |
| 6mm distance 50ohm LED | 0 | 20 | 50 | 90 | 280 |
| 8mm distance 10ohm LED | 26 | 120 | 380 | 500 | 950 |
| 8mm distance 50ohm LED | 0 | 0 | 5 | 100 | 330 |
This result also shows that with the same configuration, if the distance is larger, the analogue reading is smaller, and in the same distance and resistor on base, if the resistor on the LED is larger, the analogue reading is smaller, and also the larger the resistor on the base, the larger the analogue reading it is.
I think the next step, we need to use two LEDs for testing as they may have larger analogue readings, maybe we should use 8mm as the distance, and try to do the experiment in the solution(maybe 200NTU solution), see how it will perform.
Will start the new experiment very soon.
4th February 2020
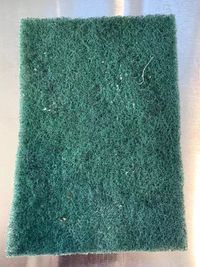
Today we are going to do the reflection test. We want to see what the analogue reading will be if we put some materials in front of the LED and the PT with different distance. Now we choose two kinds of materials, both of them have rough surface, one is the washing sponge and another is the face mask. Now the setting of the circuit is: the distance between the LED and the PT is 8mm, the resistor on the LED is 51ohm, and the resistor on the base is 5M ohm, the resistor connecting the emitter is 1M ohm. For the LED, we use 6 degree angle LED from the digi-key, the following figures shows the sponge and the face mask.
And the test results are shown below:
| Distance from the LED and the PT(mm) | 0 | 1 | 2 | 3 | 4 | 8 | 10 | 12 |
| Green sponge analogue reading | 1003 | 1003 | 1003 | 980 | 450 | 75 | 10 | 0 |
| Face mask analogue reading | 1003 | 1003 | 1003 | 990 | 639 | 34 | 0 | 0 |
In the test, we we take the analogue, we make sure that the LED and the PT are in a dark environment, and without the reflect material, the analogue reading is constantly 0.
10 February 2020
Now we think that the main problems for our turbidity sensor are two things:
1. When we use the epoxy board on the surface of the sensor box, the light would transmit from the board and it can be detected by the phototransistor, to solve this problem, we need to make the light polarized. And we can redesign the sensor box which adds a barrier in the middle of the two holes, if so, the light cannot transmit by the epoxy board. The new sensor box looks like the following picture:
2. After double-checking the mechanism of the existing turbidity sensors, it seems that all the light beam is a direct light beam without angle. Previously, the light from the LED is divergent light, and it may cause the phototransistor receives light from different directions, and maybe the floating vibration is also caused by this problem. To solve this problem, many designs use a lens in front of the LED to make the light concentrated, some designs also add a lens in front of the phototransistor as well. We try to design our new sensor box by adding a small hole in front of the LED, so the light from the LED may transmit from the little hole, maybe this light will be a direct light beam.
Now we are printing the new box by our 3D printer, after it completed, we may use the epoxy to glue a new board on the surface of the box, and then test them in the water, see what will happen.
To be continued......
13 February 2020
Until now, our turbidity sensor's analogue reading still got the fluctuation problem, sometimes the analogue reading fluctuates within a very big range, it is very difficult for us to get an accurate result. When doing an experiment, we found that the Arduino board and the LED is getting hot after a long-time work. So we thought the fluctuation problem may be caused by the unstable light source, as the Arduino and LED are getting hot, they are not in a normal working condition, if so, the LED may not emit the stable light. Therefore, we are planning to use another power supplier for the LED, to get rid of long-time working, we also use a relay in the LED circuit, the relay can make the LED work intermittently.
After we set up the circuit, we use the round hollow section turbidity sensor for testing, the sensor still got the fluctuation problem, so it seems that the problem is not caused by the unstable light from the LED.
We need to use other ways to solve this problem, to be continued……
14 February 2020
Now we still use the external power supply for the LED and looking for ways to solve the fluctuation problem. We tried to add a "pull up" function in our code to make the PT work better. After we upload our new program to the Arduino, the Analogue reading results are much more stable than those in the previous test. All the results fluctuate in a very narrow range which means we almost solve the fluctuation problem.
Now we use the round hollow section turbidity for testing, and the circuit we use is Dave's circuit, which has 2M ohm resistor on the collector and 1M ohm resistor on the base. In this test, we found that the analogue reading is too large for all the solution, for example, the reading number for DI water is about 990, and the reading number is about 900 in the 500NTU solution, that is difficult for us to analyse the results. We need to change some configurations to make the results perfect.
To be continued……
16 February 2020
We found that the analogue reading is very sensitive to the current of the LED, if we have a tiny change of the LED current, the analogue reading changes a lot. Therefore, we connect a multimeter to the circuit to measure the accurate current of the LED. Then we change the resistors on the base and collector. After we tested many times, we found that one configuration for the round hollow section turbidity sensor works very well, the results of different turbidity solution got a linear trend.
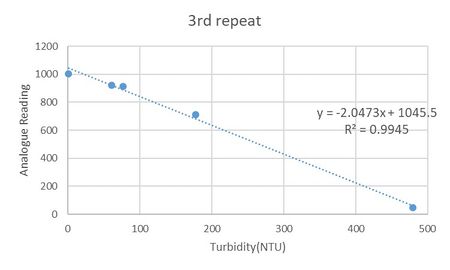
In this configuration, the resistor on the base is 4M ohm, and the resistor on the collector is 2M ohm, the current of the LED 0.1A. The result is shown in the following diagram:
Now we can use this configuration for more test, but first thing we need to do is repeat the test and make sure it is reproducible.
17 February 2020
Today we repeat yesterday's experiment. However somethings changed:
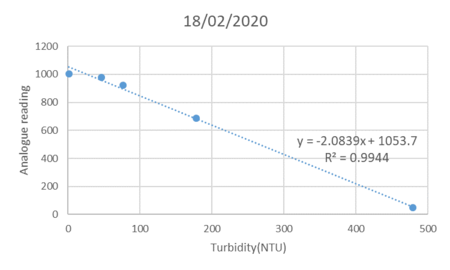
1. Today we make all the turbidity solution in the container, the container is a black box printed by our 3D printer and the black box can make sure the sensor will be in an absolutely dark environment; 2. We use our turbidity meter to test each solution to make their turbidity accurate; 3. In the first two tests, the current is 0.1A, however, the results are different, and the current always changed by itself, so in the third test, the current was changed to 0.13A and the results are better.
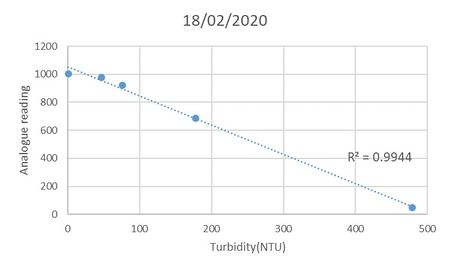
The following diagram shows the test results, the first two diagrams are results in 0.1A current, and the third one is under 0.13A current.
The following things need to be done are:
1. Keep repeating the hollow section experiment, and make sure this experiment is reproducible; 2. Try to use a flat case for testing.
To be continued……
19 February 2020
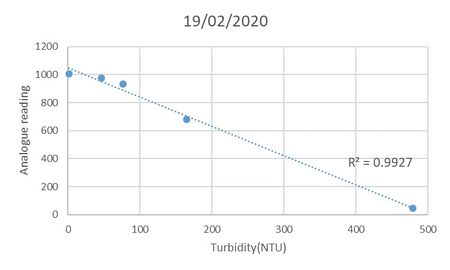
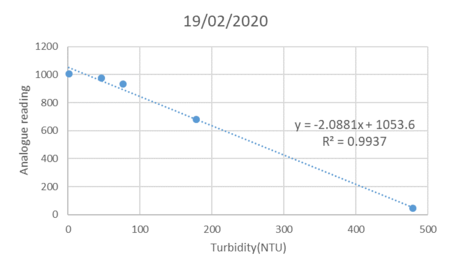
The experiment is tested every day to see if it can get the same result, the results for yesterday and today are shown below:
20 February 2020
Today we have done two things:
Repeat the previous experiment
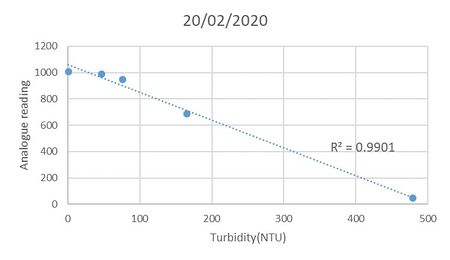
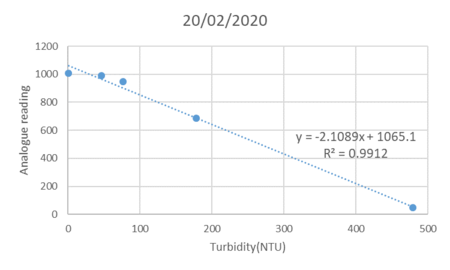
The previous test had been repeated for one more time today, the configuration was as same as the previous test, use 2M ohm resistor on the collector, 4M ohm resistor on the base and use 0.13A current for the LED, the results are shown below:
This result is similar to the past two days' results, which means the experiment can be replicated.
Try to use the flat turbidity case for testing
As we replicate the experiment successfully, we try to use the falt turbidity case for testing. For the flat case, the distance between the two holes on the case is 19mm, and the epoxy board is about 1.5mm thickness, we use the glue gun to glue the transparent epoxy board on the case, and test the case in different turbidity solution. The circuit is as same as the circular case, the only difference is to the LED and the PT in a falt case. We test the falt one in different turbidity solution, the result is shown below.
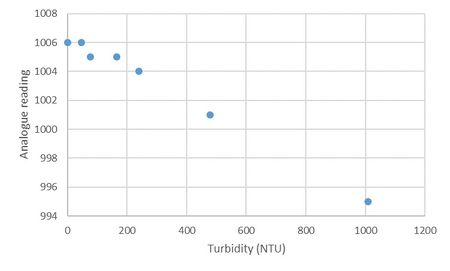
Although the points look like a linear relationship. the differential rang is too small(from 995 to 1006), so the result is not good enough.
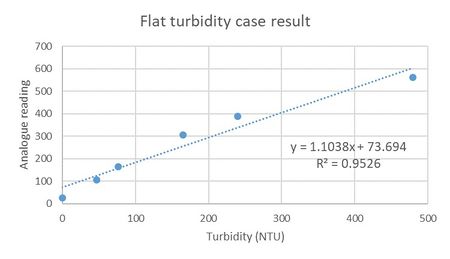
Now we want to try to change our settings of the circuit, we use a 500K potentiometer connecting on the collector, and then disconnected the base, then try to see the analogue reading. We found that, the analogue reading increases as the resistance increases. However the analogue reading for 500K ohm is still more than 70, so we changed the current of the LED to 0.25A, the reading numbers changed to 135 for the 500k resistance. So we changed the resistor to a larger one, 2M ohm resistor made the analogue reading 561 at 480NTU solution. The results can be seen in the following diagram:
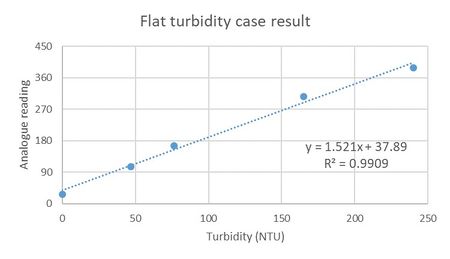
However, if we only use the first 5 points for plotting, there was a better linear trend:
Now it looks better, but still have two problems:
1. 0.25A is too large for the LED, we need to adjust it; 2. The analogue reading in the air and in DI water is not 0, we need to try to change some settings to make it perfect.
We need to repeat the test later to see if this configuration can get the same result, and we also need to adjust the configurations to optimize the performance.
To be continued……
24 February 2020
For our turbidity sensor, today we have done two things:
Repeat the previous flat case experiment
We used the same configuration of the flat case experiment last week, 0.25A current, 2M ohm resistor on the collector, and the 1.5mm coverage. Today we record 10 analogue reading numbers for each solution and used the average number to plot the diagram.
This time, the trend is similar to the results last week, but the numbers are different. Today the reading numbers are smaller than those we recorded last week, but still form a linear relationship. We need to keep repeating the experiment every day to see if it can still get the same results. Today's results are shown below:
Change the distance between the two holes
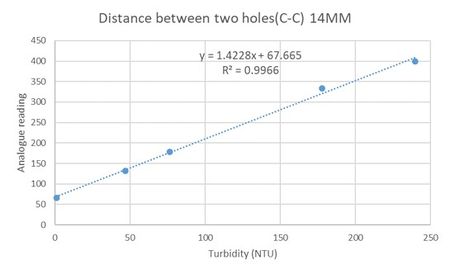
As the 0.25A current is too large for the LED and this also consumes too much power, we want to change it to low current, but it will affect the analogue reading numbers, so we tested the new case with a closer distance between two holes. The distance between two holes is 14mm now. Firstly, we still use the 0.25A current and see how the reading numbers change, with this configuration, the analogue reading number increased for each solution. The results can be seen in the following diagram:
With these results, we still used the 14mm case but changed the current to 0.1A, the reading number for DI water changed to 28, but the analogue reading in 240NTU solution changed to 93, that number is too small, so the next step we try to change the resistor on the collector, or make the distance between two holes closer.
Another thing is that the PT can get better performance at the solution below 300NTU, we are thinking to use a photodiode in our sensor as well.
To be continued……
27 February 2020
Too busy these days, new update for our turbidity sensor.
Today we did several things:
Repeat the circular case turbidity sensor experiment
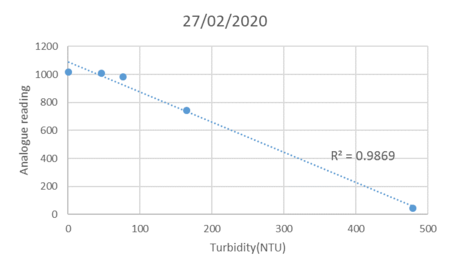
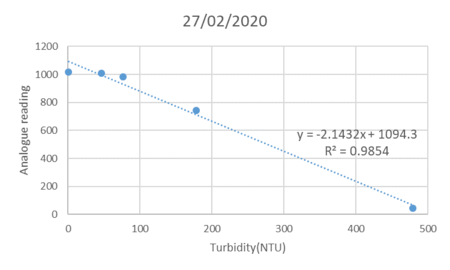
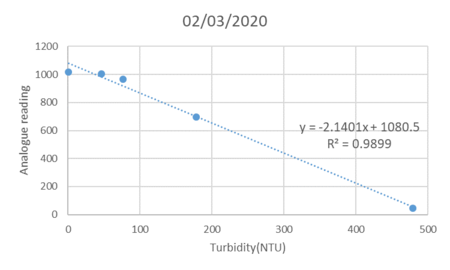
Today we repeated the circular sensor experiment, we did not change any configuration, all the settings are as same as before: 0.13A current for the LED, 4M ohm resistor on the base, 2M ohm resistor on the collector, we also take 10 analogue readings for each solution and calculate the average number of the analogue reading for plotting.
Today's results are higher than the previous results, and the points did not fit a linear relationship perfectly, R square for the points is 0.987, the results and diagram are shown below.
| Turbidity(NTU) | 1(DI water) | 46.8 | 76.5 | 178 | 479 |
| Analogue Reading | 1017 | 1007 | 984 | 743 | 47 |
we have checked all the connections and the circuit, there is no difference with the previous configuration, the difference may be caused by the unstable power supply of the LED, as the current of the LED can be measured by the multimeter, the current changed slightly during the experiment, that may be the reason of the difference.
Repeat the flat case turbidity sensor
We use the flat case with 19mm distance between two holes, also we connect 2M ohm resistor on the collector, the current for the LED is 0.25A, the thickness of the coverage is 1.5mm, we used the glue gun to glue it on the surface of the case. Similarly, we recorded ten readings numbers and calculate the average. This time, the results are similar to the results in the previous experiment. The diagram below shows the results:
test the different hole distance case
As 0.25A is too large for the LED and it also consumes too much energy, we need to change the current lower, now we use 0.1A current for the LED, and then make the two holes closer. Today we used 0.1A current for our LED and tested four different cases, the distance between the two holes of the four cases are 19mm, 14mm,12mm and 10mm respectively. Each case we tested different solution, and then compare their performance, and also see which one is the best for our sensor.
The results are shown in the following diagram:
From the diagram it can be seen that the results of all the cases followed a linear relationship, the closer the distance, the wider the range is. For example, for the 10mm distance case, the largest number is 744 for 1010NTU, and the smallest number is 68 for DI water, the 12mm distance performs similar to the 10mm distance case. The wider range works better for our monitoring. Next time, we can try to use 10mm case for further test.
Validate the middle barrier test
Last time we thought that it should be useful to add a barrier in the middle of the epoxy board, because the light may transmit by the epoxy board and affect the analogue reading. These days we were using two small pieces of epoxy board to cover the LED and the PT respectively, and use the glue gun to make a barrier in the middle. Today we did a test to validate the function of the middle barrier.
We use two 19mm distance flat case, one with a middle barrier, another one uses an entire epoxy board to cover the LED and the PT(without barrier), then tested them in different solution, compare the analogue readings.
The results are shown below:
| Turbidity(NTU) | 1010 | 479 | 240 | 178 | 76.5 | 46.8 | 1 |
| without middle barrier | 467 | 280 | 170 | 152 | 75 | 57 | 39 |
| with barrier | 396 | 262 | 162 | 132 | 72 | 53 | 29 |
From the results, the reading numbers for the case with barrier are smaller than that without middle barrier, although not too much difference but make sense. That may caused by the long distance between the two holes, 19mm distance is a little bit far for the LED and the PT, light could not transmit easily with this distance. However, this experiment shows that it is useful to add a barrier in the middle to prevent light transmitting through the transparent board.
Next step work:
1. Use 10mm distance case for further tests, change the resistors to make the reading number better;
2. Calibration for the sensor to see which range turbidity is best for the PT's performance;
3. Prepare the experiment for the photodiode(depends on the results of calibration).
To be continued……
2nd March 2020
Repeat the circular case test
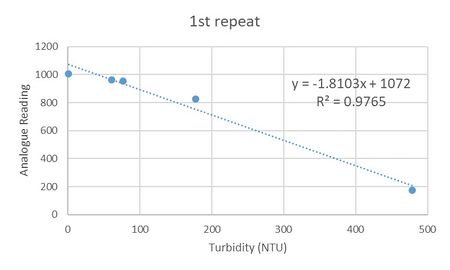
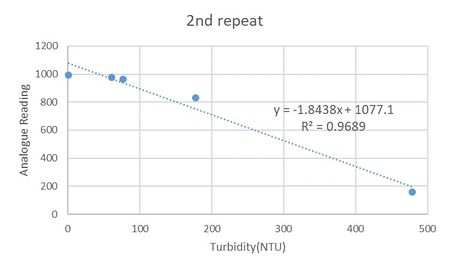
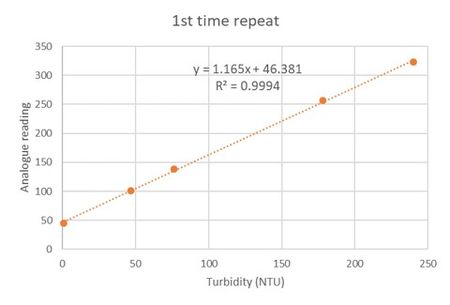
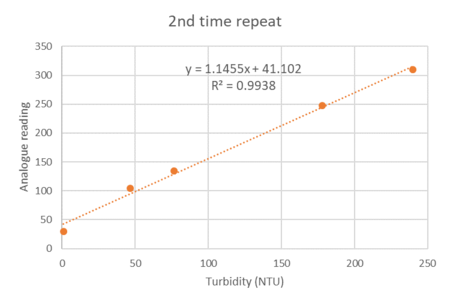
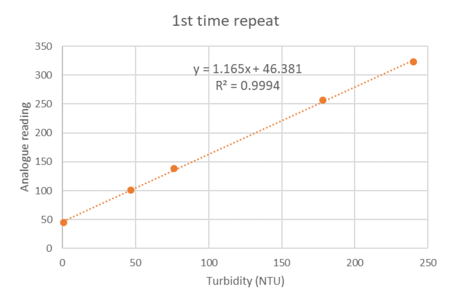
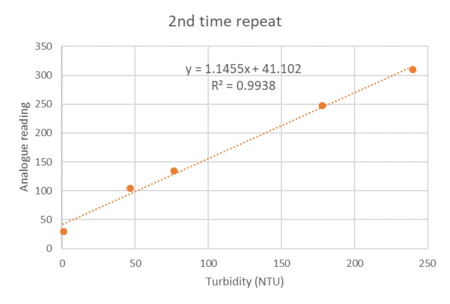
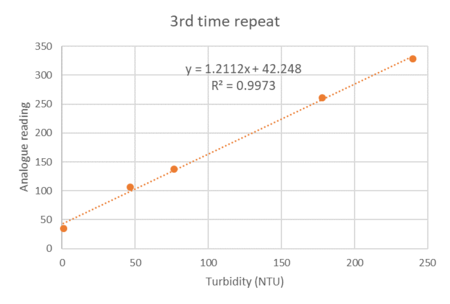
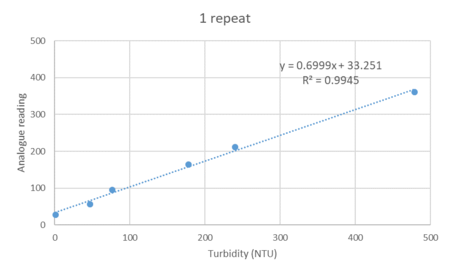
Today we did the 5th repeat test of the circular turbidity sensor. This test roughly fit a linear relationship, but not as perfect as the previous experiment. The five times result can be seen in the following diagrams:
From the diagrams above, we can see the reading numbers are stable, but still have uncertainty.
Repeat the flat surface case with 19mm distance experiment
We used the 19mm distance flat case for testing, today's test is the 3rd time test, the test is similar to the circular test, the results of the three test are shown below.
It also has problems, for this case, the linear relationship only fit the turbidity solution between 0 to 250NTU, if we plot the curve including 480NTU result, the points do not fit a good linear line. The diagrams are shown below.
Test 12mm distance flat surface case
As we tested last time, the 12mm distance flat case and the 10mm distance flat case have a wider range of results, as the 10mm distance is too close, we used 12mm distance case for testing. The test we did today recorded ten reading numbers for each solution, and use the average to plot the curve.
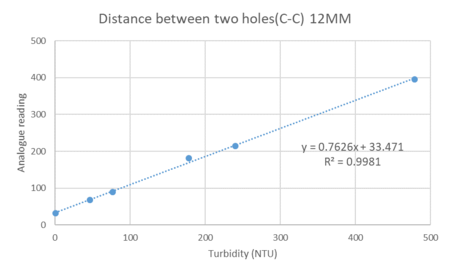
The readings from 0 to 479NTU solution fit a perfect linear relationship(R square is 0.9981), if we plot the 1010NTU result on the curve, the curve did not fit the linear relationship perfectly, R square is 0.9889, still not bad. The following diagram shows the result:
3rd March 2020
Today we repeated the 12mm distance flat surface test.
Previously, we use the glue gun to form the middle barrier of the case, now we found the light may transmit throuth the glue gun material, so we change the middle barrier. Now we used the epoxy to glue the two pieces of epoxy cover on the case, and glue a piece of blue tack in the middle and then test the sensor. The following diagram shows the result:
Both of the reuslts form not bad linear relationship, but still have uncertainty, next step we need do two things: 1. repeat the test again and again to get as more results as possible, and then determine the uncertainty; 2. use a regulator to make the input voltage constant and then do the test.
To be continued……
4th March 2020
Today, we tested the middle barrier test again. Previously, we use the case which is 19mm distance between two holes, we thought it is too far away for the light to transmit, so we are not sure if the middle barrier can be used or not. Today we used the 12mm distance case for the test, one with middle barrier which is blue tack, and another one is a whole epoxy board on the surface, the two testing case can be seen in the following picture.
In this test, we tested the middle barrier case for two times, and tested the case without middle barrier once, each test we recorded 10 analogue reading numbers and used the average value for plotting. All the results showed a not bad linear relationship, especially for 0-500NTU turbidity solution. The results and diagrams are shown below.
The experiment results can be seen in the table below:
| Item | 1010NTU | 479NTU | 240NTU | 165NTU | 76.5NTU | 46.8NTU | 1NTU(DI water) |
| case without middle barrier | 839.8 | 432.3 | 268.6 | 203.4 | 107.5 | 75.9 | 32.5 |
| case with middle barrier 1st time | 620.9 | 365.5 | 212.1 | 161.6 | 84.3 | 57 | 35.5 |
| case with middle barrier 2nd time | 619.8 | 368.2 | 213.3 | 167.6 | 86 | 57.6 | 32.3 |
We can also see the plotting diagram:
From the results, it can be seen that the analogue range for without middle barrier case is larger than the other one, and the results also form a linear relationship, so the case without middle barrier works better.
In the following experiment, we will try to use the case without the middle barrier for further testing.
12th March 2020
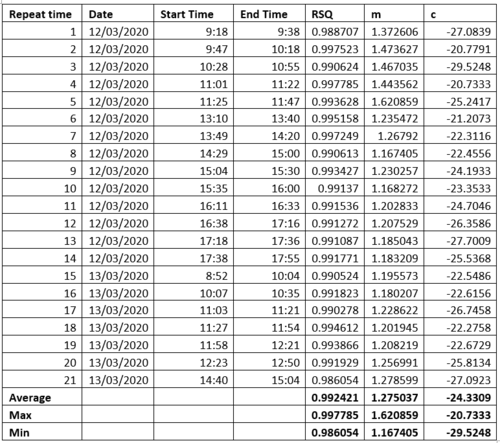
In the past week, we used the flat case with a whole epoxy board to repeat the test. We want to know the uncertainty of the sensor. So we want to repeat the test several times, if the data is enough, we can use them to determine the relationship of the analogue reading and the turbidity, and also the uncertainty of the sensor.
For the configuration of the test: The distance between the two holes: 12mm The thickness of the epoxy board: 1.5mm Collector: 2M ohm resistor LED: 1.56v voltage and 0.1A current
Until now, we have repeated 21 tests. The results can be seen in the following table:
From the table, we can see that the R square is not bad, but the slope and the intercept varies a lot. We thought it is still the problem of the external power supplier of the LED. When we tested the sensor, the current of the LED always changes, we have to manually change the voltage to make the LED current 0.1A, but it still not stable enough. Sometimes the unstable voltage will affect the performance of the LED. We need to use a regulator to make the voltage constant.
When the LED has 0.1A current, the voltage for the DC power is 1.55V. So next step we will buy a 1.55 voltage regulator to make the voltage constant and stable, and then repeat our test.
14th March 2020
We got the 1.55v voltage regulator. And when we use the regulator in our circuit, the output voltage of the regulator is constantly 1.54V. The circuit of the LED can be seen as follows:
But when we test the circuit, the current of LED is only 0.07A, the voltage drop of the circuit is 1.4v not 1.54v. We think it may be the problem of the relay, so we did not connect the relay in the circuit, just connect the LED in the circuit, now the circuit is like the following diagram.
With this circuit, the voltage drop of the LED is also 1.4v, so the current of the LED is not 0.1A.
But the LED still works, as the voltage decrease, the analogue reading number became smaller, which means it still forms a kind of relationship, but the range of the analogue reading is narrow. For example, the analogue reading number of 1000NTU turbidity solution is around 660 but now it is only more than 420.
We are waiting for our new regulator to come, and before that, we will use this one for testing, and see what kind of relationship will it form.
16th March 2020
We start to test the sensor, today we did not use realy in the LED circuit, we keep the LED on, and the current of the LED is 0.07A. Each time after the test, we used the turbidity meter to test the turbidity of the solution in the solution to make the experiment more accurate. After 6 tests, the results can be seen as the table below:
These results are not bad, as the voltage regulator can output the constant voltage, the slop and the intersection of the line has less vibration. However, in the field, we still want to make the LED work intermittently, so next step, we will add the relay in our circuit and repeat the test.
17th March 2020
Today we used the relay in our LED circuit, and other things did not change. We have done 6 tests today, the results can be seen as follows:
Now the results are not bad, when the new regulator comes, we can use 0.1A to test the performance, if it still works well, we can use the regulator for our design.
The next step, we have several things to do: 1. Use our BoSL board for further testing; 2. Get motor work for wiper; 3. Design the PCB for the sensor.
18th March 2020
After fieldwork today, we repeated two times of the experiment in the afternoon, the results can be seen as follows:
19th March 2020
Today, we change a little bit of the LED circuit, we put the relay just before the LED and then still repeat the test for 14 times, now we have already repeated the test for 20 times. The summary results can be seen in the following diagram:
It can be seen that the slop is slightly different from the test before we change the relay. I think the problem does not come from changing the circuit, but from the connection of the breadboard. Although the result is different, there is no large vibration which is good. The next step I think we need to do is design the circuit and PCB board, and wait for the new regulator comes and do more tests.
24th March 2020
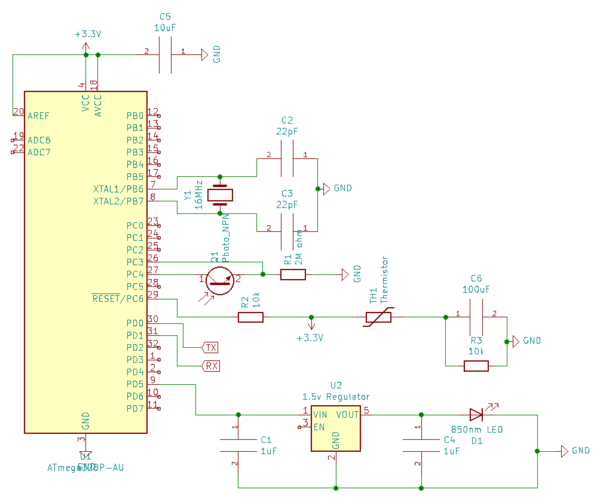
Today we designed the circuit of the board, we use the ATmega328P-AU as our controller, the circuit diagram can be seen as the following diagram, it has already been sent to Stephen for double-check, once it is confirmed, we can process to test it. Next step we need to design the case of the sensor with the motor.
26th March 2020
Today we did several things:
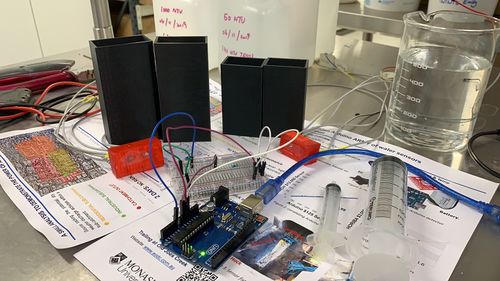
Test the breadboard Arduino
Now we have already set up a breadboard Arduino, base on this test, we are sure that the chip can be used on the PCB to control the turbidity sensor. This time, we did not upload the turbidity sensor code on the board, for testing purpose, we only use a simple blink code to make a LED blink. As it works successfully, we can use a similar thing later for testing.
Next step, we will only use this chip to control the turbidity sensor and see if the results will be the same.
Test the BosL board turbidity sensor
We connect the turbidity sensor on our BoSL board, just like the circuit diagram above, we use two digital pins and "HIGH" and "LOW" code to control on and off of the LED and the phototransistor, but we got the problem, as the digital pin of Arduino can output maximum 20mA current, however the current we need for our LED is 100mA, so this connection is not able to support the turbidity.
To ensure we still control on and off of the turbidity sensor, we need to change our design, the power of the LED circuit will be provided by 3.3v directly, but we need to use an NPN transistor to work as a switch, and then use the digital pin to control the whole circuit.
Change the design of the circuit
Due to the issue we talked above, we have to change our circuit, not only the LED diagram, but also the crystal, now we change the 16Mhz crystal to 8Mhz crystal. We also add some pins on the board.
